Repeated Measures ANOVA
Repeated Measures ANOVA. Starting with One-Way RM More fascinating than a bowl of porridge. 1. . One-Way Repeated Measures ANOVA. Data considerations One interval/ratio dependent variable One categorical independent variable of > 2 levels


Repeated Measures ANOVA
E N D
Presentation Transcript
Repeated Measures ANOVA Starting with One-Way RM More fascinating than a bowl of porridge 1.
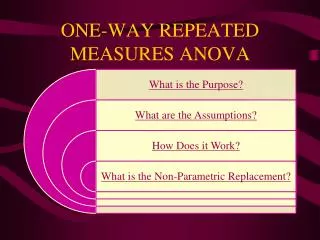
One-Way Repeated Measures ANOVA • Data considerations • One interval/ratio dependent variable • One categorical independent variable of > 2 levels • Analogous to dependent t-test, but for more than 2 levels of the independent variable • So here people are measured more than two times • All participants participate in all levels of the IV • E.g. midterm, final, quiz score for this class in SP 2009 1.
One-Way Repeated Measures ANOVA • Advantages of repeated measures • Again, as per paired t-test... • Sensitivity • Reduction in error variance (subjects serve as own controls) • So, more sensitive to experimental effects • Economy • Need less participants • With many levels, this might be even more important for ANOVA than t-test • (need to be careful of fatigue effects, though) 1.
One-Way Repeated Measures ANOVA • Possible serious disadvantage of RM • Order effects and treatment carry-over effects (goes for paired t-test too) • E.g. three chocolates…one’s bad, the others good • Should counterbalance (randomly assign to treatment order) • E.g. (for 2 levels of RM: A & B) 1. 2. 3. 4.
One-Way Repeated Measures ANOVA • Possible serious disadvantage of RM • Order effects (goes for paired t-test too) • E.g. (for 3 levels of RM: A, B & C) 1. This type of control for order effects is known as a Latin Square design
One-Way Repeated Measures ANOVA • Possible serious disadvantage of RM • Treatment carry-over effects (goes for paired t-test too) • Even if order effects are controlled for, there must be sufficient time between treatments so that you can be sure that the score on each level of the RM is due to only one treatment (not a combination of two or more) • Note – order & treatment carry-over effects are design rather than statistical issues, but very important nevertheless 1.
One-Way Repeated Measures ANOVA 1. • Example, with chat about variance partitioning and assumptions... • Remember the one-way between subjects ANOVA? • Data looked like this in SPSS • And the trick was to make variance due to treatments bigger than variance due to everything else (& everything else included variance due to individual differences) • Well, what if you could take out variance due to individual differences? 2. 3. 4.
One-Way Repeated Measures ANOVA • That’s what the one-way RM ANOVA does • Data now looks like this, as each person is measured on all levels of the IV • Variation due to individual differences can then be separated from variation due to chance, as the same people are present within each condition. 1. 2.
One-Way Repeated Measures ANOVA • Now a pause before we consider variance partitioning in RM ANOVA, as we see how to conduct the test. • Here’s the first step 1. Choose this...
One-Way Repeated Measures ANOVA 2. Then click “add” and proceed by clicking “define” 1. Type in the variable name (“drug”) where it says “factor1”, and the number of levels it has (4)
One-Way Repeated Measures ANOVA 1. ...next you choose all the levels of the repeated measures factor (i.v.)... 3. 2. And slide them over to the “within subjects variables” box – just another name for repeated measures variable...or factor
One-Way Repeated Measures ANOVA • Output 1. 2. This first bit is from the multivariate (more than one dependent variable – 4 here) approach to repeated measures. It has some potential advantages (essentially that one does not have to meet the sphericity assumption...see next slide)
One-Way Repeated Measures ANOVA • And...more output... 1. This bit is important. It’s a test of one of the more important assumptions of RM ANOVA – sphericity. It’s kind of like the homogeneity of variance test, but it’s the variance of the difference scores between the levels of the independent variable that are being tested…you really have to adjust for it, & we see how on the next slide (if this is NOT significant, it’s good) 3. sphericity… 2. What to do… Another important bit…the Huynh-Feldt Epsilon...see next slide
One-Way Repeated Measures ANOVA • And...still more output... Finally, the bit that counts. Note there are FOUR (count ‘em) separate versions of each effect. Here’s the rule (Schutz & Gessaroli, 1993): If Huynh-Feldt Epsilon (see previous slide) is > .7, use Huynh-Feldt adjusted F (third line). If it is less than .7, use G-G (second line) 2. 1.
One-Way Repeated Measures ANOVA • Same bit once again... 1. Here, you can see that, as the epsilon is 1, there is no correction, and the F statistic stays the same throughout. 2.
One-Way Repeated Measures ANOVA • One last bit (that you can ignore)... 1. Let’s just look at this first. In the top box, you can see a bunch of stuff like “linear”, “quadratic”, & “cubic” – that’s to do with the shape of the difference that the change in scores might take as they progress from drug 1 to drug 4, and only really makes sense in trend analysis, which is again beyond our scope. Finally, down here you see “between subjects effects”. There are none here (just one I.V., and it’s RM). The error variance here is essentially a measure of individual differences, as we’ll see in a minute... 2.
One-Way Repeated Measures ANOVA • So, how does the variance thing work? • Let’s compare the two methods (“between subjects” and “repeated measures”) directly, bearing in mind where the variances in the output tables come from • In this way, my goal is simply to indicate the benefit of taking out variation due to individual differences • We’ll start with the between subjects method...(see next slide) 1. 2. Simply put… 3.
One-Way Repeated Measures ANOVA 5. 4. Here the between groups variance is 698.2 – this is just variation of mean scores on the different treatments about the overall mean...so this is the bit that is essentially the treatment effect 2. 26.4 1. 25.6 15.6 And here is the within subjects variation...it is calculated from the sum of the variation within each of the treatments about each of the treatment means 32 3.
One-Way Repeated Measures ANOVA 1. • Now for the repeated measures version: Note that the average score for each subject across the four treatments is different. This is due to individual differences...and is the “between subjects” error variance 27 16 23 34 3. 24.5 2. • The thing that makes repeated measures powerful is that this variation is taken out of the within subjects error term...see next slide Sum of squares = 680.8 (= sum of squared deviations from the mean of these 5 scores, which is 24.9, multiplied by the # levels of the I. V.)) 4.
One-Way Repeated Measures ANOVA 1. 3. 4. 2. Error SS in non-RM ANOVA = 793.6 Error SS in RM ANOVA = 793.6 – 680.8 = 112.8
One-Way Repeated Measures ANOVA Now what you have to see is that the SS for the denominator in the F test in RM is now 112.8, which is derived from 793.6 – 680.8 = 112.8 1. 4. individual differences 2. Error variation in between subjects ANOVA 3.
One-Way Repeated Measures ANOVA 1. And finally, as a direct consequence of all this, the numerator in the F-test is unchanged (698.2), but the denominator has been reduced from 49.6 to 9.4, resulting in an increase in F from 4.69 to 24.76! 2. which of course means...more significance, more power
One-Way Repeated Measures ANOVA • So, to summarize • Because of the way RM ANOVA partitions variance for the RM factors, we have a far more powerful test for the RM factors • But you have to make sure you control for spurious effects by controlling for order effects and carryover effects • Also crucial that you adjust for violations of sphericity 1.
Example of interpretation of results Note partial η2 is reported too • Interpretation: • A one-way repeated measures ANOVA was conducted to student’s confidence in statistics prior to the class, immediately following the class, and three months after the class. Due to a mild violation of the sphericity assumption ( = .82), the Huynh-Feldt adjusted F was used. There was a significant difference in confidence levels across time, F (1.421, 41.205) = 33.186, p < .001, partial η2 = .86. Dependent t-tests were used as post-hoc tests for significant differences with Bonferroni-adjusted = .017. Confidence levels after three months (M = 25.03, SD = 5.20) were significantly higher than immediately following the class (M = 21.87, SD = 5.59), which in turn were significantly higher than pre-test levels (M = 19.00, SD = 5.37). 1. 2.
ANOVA/Inferential Statistics Wrap-up • Inferential tests to compare differences in groups: • Independent t-tests • Dependent t-tests • One-way ANOVA • Factorial ANOVA • One-way repeated measures ANOVA • Factorial repeated measures ANOVA • Mixed between-within groups ANOVA (split-plot) • Analysis of covariance (ANCOVA) • Multivariate analysis of variance (MANOVA) • Nonparametric tests (next) 1. 2.
Factorial RM ANOVA • Same notions as for factorial ANOVA – main effects, interactions and so on • Data set up a bit tricky
Two-way ANOVA with repeated measures on one factor • Sometimes referred to as a split plot or Lindquist type 1 or (most commonly in my experience) a “Two-way ANOVA with repeated measures on one factor.” • Research question: Which diet (traditional, low carb, exercise only) is more effective in weight loss across three time periods (before diet, three months later, six months later)? Is there a weight loss across time?
Two-way ANOVA with repeated measures on one factor • Diet RQ (continued) • Looks like a 3x3 two-factor ANOVA, except that one of the factors is a repeated measure (one group of subjects tested three times) • As such, a two-factor between-groups ANOVA is not appropriate; rather, we have one factor that is between diet types and another that is within a single group of subjects
Two-way ANOVA with repeated measures on one factor • Use a mixed design ANOVA when: • A nominal between-subjects IV with 2+ levels • A nominal within-subjects IV with 2+ levels • A continuous interval/ratio DV • Note: you can add additional IV’s to this test, but just as with Factorial ANOVA, when you get 3+ IV’s, interpreting findings gets really nasty due to all of the interactions
Two-way ANOVA with repeated measures on one factor • Interactions: like a two-factor between-subjects ANOVA, there may be both main effects for each of the two IV’s plus an interaction between the two IV’s
Analysis of Covariance • An extension of ANOVA that allows you to explore differences between groups while statistically controlling for an additional continuous variable • Can be used with a nonequivalent groups pre-test/post-test design to control for differences in pre-test scores with pre-existing groups • You could use a mixed design ANOVA here, but with small sample size, ANCOVA may be a better alternative due to increased statistical power • Be careful of regression towards the mean as a cause of post-test differences (after using the covariate to adjust pre-test scores)
Multivariate Analysis of Variance • An extension of ANOVA for use with multiple dependent variables • With multiple DV’s, you could simply use multiple ANOVA’s (one per DV), but risk inflated Type 1 error • Same reason we didn’t conduct multiple t-tests instead of an ANOVA • Ex. Do differences exist in GRE scores and grad school GPA based on race? • There are such things as Factorial MANOVA’s, RM MANOVA’s, and even MANCOVA’s