Download
1 / 1
10 likes | 140 Vues
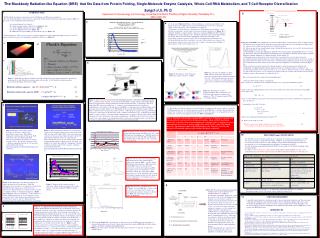
This research presents the Blackbody Radiation-like Equation (BRE) proposed by Sungchul Ji, which successfully fits experimental data from diverse biological processes, including protein folding, single-molecule enzyme kinetics, whole-cell RNA metabolism, and T-cell receptor diversification. The study highlights the significance of BRE in understanding enzyme catalysis mechanisms and its surprising implications. The poster discusses methodology, provides visual data comparisons, and introduces the RASER model of enzyme catalysis, drawing parallels with laser physics that could enhance our grasp of biochemical reactions.

E N D
The Blackbody Radiation-like Equation (BRE) that fits Data from Protein Folding, Single-Molecule Enzyme Catalysis, Whole-Cell RNA Metabolism, and T-Cell Receptor Diversification Sungchul Ji, Ph. D. Department of Pharmacology and Toxicology, Ernest Mario School of Pharmacy, Rutgers University, Piscataway, N.J. sji@rci.rutgers.edu 7 5 2 1 INTRODUCTION 9 [1] The blackbody radiation equation discovered by M. Planck in 1900 is shown in Figure 1. [2] One of the main purposes of this poster is to present the evidence that the blackbody radiation-like equation (BRE) (see Eq. (3) below) fits experimental data obtained from: (A) protein folding [1] (see Panel 4) (B) single-molecule enzyme catalysis [1] (see Figures 5 & 6) (C) whole-cell RNA synthesis rates [1] (see Table 1) (D) whole-cell RNA levels [1] (see Figure 10) (E) Human T-cell receptor CDR3 gene diversification [2] (see Figure 11). [3] Another purpose of this poster is to propose a possible explanation for these surprising findings in terms of a model of enzyme catalysis that shares some mechanistic similarities with laser (see Figure 15). 4 6 (6) As shown in Figure 11, BRE also fits the distributions of generation probabilities of the human T-cell receptor CDR3 sequences predicted by Murugan et al. based on a statistical model of the T-cell receptor gene recombination processes [2]. (7) Murugan et al. [2] predicted two distributions of CDR3 generation probabilities , one for the naïve non-productive and the other for the naïve productive repertoires (see Figure 12), of which the distribution of the productive sequences is simulated in Figure 11. The deviation of the BRE curve from the Murugan et al’s “productive repertoire” curve is pronounced toward the tail end. This deviation should be significantly reduced if the distribution of the nonproductive sequence repertoire is used. This is encouraging because Murugan et al’s theoretical distribution model is constructed to account for the redceptor gene variaons of the non-productive repertoire and not that of the does not apply to the generation probabilities of the productive receptor gene sequences [2, p. 7]. Figure 15. The RASER (Rate Amplification by Substrate-Enhancement of reaction Rates) model of enzyme catalysis. (a) Unlike electrons in atoms that are all in the lowest-energy ground state before absorbing photons (Figure 6 and 14), enzymes exist in different ground states before thermal excitation.(b) Wen an enzyme absorbs enough thermal energies through Brownian motions, it is excited to the transition state typically lasting 10-14 to 10-12 seconds.(c) The thermally excited enzyme undergoes a transition to the “activated state” lasting probably up to 10-9 seconds.(d) The activate state can be deactivated (i) spontaneously (as in “spontaneous emission” in laser, Figure 14) and (ii) induced by substrate binding (as in “induced emission” in laser, Figure 14).(e) During spontaneous deactivation of the activated state of an enzyme, the excess energy is released as uncoordinated and random infrared photons, whereas during the substrate-induced deactivation, the excess energy of the enzyme-substrate complex may be released in a coordinated manner resulting in catalysis, just as the triggering photon-induced de-activation of electrons in atoms results in the amplification of emitted photons in laser (Figure 14).(f) The coherent wave packets generated by substrate binding to activated enzyme may be idetified with “conformons”, mechanical energies stored in sequence-specific sites within biopolymers [1, Chapter 8; 1a].(g) The enzyme catalytic cycle consists of 3 steps, 1->2, 2->3, and 3->1. If the rate of steps 3->1 are determined by (or equal to) the rate of Step 1->2, we can derive an equation for the rate constant of the enzyme reaction using the Arrhenius equation. Rate constant, k, is defined by Eq. (1): Rate = k [enzyme-substrate complex] = k [enzyme][substrate] . . . . . . . . . . . . . (1) where the square brackets indicate concentrations. Rate constant, k, of a chemical reaction, whether catalyzed or not, is given by the Arrhenius equation: k = Ae-ΔG‡ /RT . . . . . . . . . . . . . . . . . . . . . . . . . . . . . . . . . . . . . . . . . . . . (2) where A is the “pre-exponential factor”, ΔG‡ is the activation Gibbs free energy. The activation free energy ΔG‡ can be expressed as ΔG‡ = G‡ - Gi . . . . . . . . . . . . . . . . . . . . . . . . . . . . . . . . . . . . . . . . . . . (3) where G‡ is the Gibbs free energy level of the enzyme at the transition state and Gi is the Gibbs free energy level of the ith ground state. Inserting Eq. (3) into Eq. (2) leads to k = Ae-ΔG‡ /RT = Ae- (G‡ - Gi )/RT = A(e- G‡/RT)(eGi/RT ) = A’eGi/RT . . . . . . . . . . . . . . . . . . . . . . . . . . . . . . . . . . . (4) where A’ is a constant given by the product of A and e-G‡/RT. (9) The key point of Eq. (4) is that “The rate constant of an enzyme-catalyzed reaction is determined . . . . . . . . . . . . . . . . . (5) by the Gibbs free energy level of the ground state of the enzyme.” (a) (C) (b) Figure 12. Generation probabilities of all the CDRs sequences in the naïve and productive repertoires computed using an inferred distribution [2, p. 13]. The productive repertoire curve was reversed in its x-direction by subtracting the x-values from a constant before plotting in Figure 11. Figure 11. The fitting of the T-cell receptor CDR3 gene sequence variations to BRE. Figure 1. (a) Blackbody radiation: All matter emits light with different wavelengths and intensities when heated producing the so-called blackbody radiation spectra shown in (b). (c) The blackbody radiation equation discovered by M. Planck (1858-1947) in 1900. Blackbody radiation equation: u(λ, T) = (8πhc/λ5)/(ehc/λkT – 1) (1) Blackbody radiation-like equation (BRE): y = (a/x5)/(eb/x - 1) (2) y =(a(Ax + B)-5)/(eb/(Ax + B) – 1) (3) Figure 13. Recombinases viewed as molecular machines that are designed to edit DNA nucleotide sequences to generate new sequences. CTD = C-terminal domains; NTDs = N-terminal domains (8) The fact that (i) blackbody radiation, (ii) protein folding, (iii) single-molecule enzyme catalysis, (iv) whole-cell RNA metabolism, and (v) T-cell receptor gene variations all fit BRE, Eq. (3), indicates that the Gibbs free energy levels of enzymes (also called molecular machines), both in vitro and in cyto, are quantized just as the energy levels of electrons are quantized in atoms (see Table 1 and Figure 6). Figure 2. The fluorescence image of single molecules of cholesterol oxidase (COx) immobilized in agarose gel. When FAD is illuminated at 442 nm, the prosthetic group, FAD, emits fluorescence at 530. Each individual fluorescent spot indicates the presence of a single molecule of COx. The intensity variations are due to different longitudinal positions of COx molecules in the gel. Reproduced from http://www.nigms.nih.gov/News/Reports/single_molecules.htm Figure 3 The measurement of the turnover of a cholesterol oxidase (COx) molecule in the presence of cholesterol (0.20 mM) and oxygen (0.25 mM). FAD, is fluorescent when in its oxidized state with an average relative intensity of about 130 units (which is referred to as the “on“ state) and non-fluorescent when in its reduced state with an average intensity of about 40 units (which is referred to as the “off” state). The length of “on” state is also called the “waiting time”, the time an enzyme molecule awaits before it catalyzes a chemical reaction. Reproduced from http://www.nigms.nih.gov/News/Reports/single_molecules.htm. Figure 8. Typical results of microarray measurements of the time-dependent genome-wide RNA levels (also called RNA trajectories) in budding yeast . The RNA trajectories were measured at 0, 4, 120, 360, 450 and 850 minutes after replacing glucose with galactose. TL = transcript level. Data from [5]. 10 DISCUSSION and CONCLUSIONS (10) The Raser model of enzyme catalysis proposed in Figure 15 is built upon the quantization of Gibbs free energy of enzymes as suggested by the fitting to BRE of the experimental data measured from various enzyme-catalyzed processes. These findings strongly indicate that the living cell and the atom are connected via a set of fundamental physical principles, as summarized in Table 2. (11) One of the most interesting results listed in Table 2 is the concept of “cell orbital” in analogy to that of “atomic orbital”. (12) The Cell Orbital Hypothesis: Just as atomic orbitals impart structural stability to atoms, so it is postulated here that cell orbitals impart functional stabilities (functional robustness) to the living cell. 3 Figure 9. The tree steps involved in analyzing RNA kinetic data in terms of the blackbody radiation-like equation (BRE). (a) The original RNA kinetic data in the form of RNA trajectories. (b) Each RNA trajectories from (a) can be represented s a point in the 6-dimensional RNA concentration space. (c) The distances (or dis-similarities) among all possible pairs of RNA trajectories in (a) can be calculated from (b) using the Euclidean formula and these n(n-1)/2 distances can be classified into a set of distance classes to generate a histogram. (10) (11) Figure 4. The distribution of the kinetic parameters (on-times) measured from COx molecules. (Left) The distribution of the on-times (i.e., the duration of the times that the FAD molecule remains in its oxidized state and fluorescent). This phenomenon of varying on-times is known as ‘dynamic disorder’ or ‘dynamic heterogeneity’. (Right) The distribution of the rate constants, k2, for the reduction of FAD to FADH2 measured from 33 COx molecules. At any given time, the k2 values measured from different molecules of COx vary by a factor of up to 5. Reproduced from http://www.nigms.nih.gov/News/Reports/single_molecules.htm Figure 5. Single-molecule enzymic activity of cholesterol oxidase activity measured in [7] (see blue squares) is partially simulated by BRE (see purple squares). 8 Figure 10. The fitting of the RNA distance data (see Figure 3 (c)) into BRE, Eq. (3), with a = 109, b = 47.5, A = 2 and B = 2 [6, 7]. Circles are experimental data, and the solid curve is derived from BRE. The curve fitting software was written by Kenneth So. aIntracellular Dissipative Structures , e.g., membrane potential, RNA gradients; Ca++ gradients bMechanical energy stored in site-specific regions within biopolymers [1a]. Figure 14. The quantum mechanical mechanisms underlying laser, Light-Amplification by Stimulated Emission of Radiation. (a) The input of “pumping” photons, hν1, causes the electrons of the atoms constituting the laser medium (e.g., ruby crystal) to undergo a transition from the ground-state energy level to the excited-state energy level (from 1 to 2). (b) The excited state lasts for only 10-12 seconds or less, loses some of its energy as heat and undergoes a transition to a lower energy level called “metastable” state (from 2 to 3). (c) When there are enough number of electrons in the excited state (“population inversion”), the arrival of triggering photons, hν2, induces the de-excitation of electrons from the metastable excited state to the ground state (from 3 to 1), accompanied by the emission of photons identical to the triggering photons, hν2, but larger in number than the original triggering photons.(d) The emitted photons are “coherent” in in that they are identical with respect to (i) amplitude, (ii) frequency, and (ii) phase. TL 11 ACKNOWLEDGEMENT I gratefully acknowledge the contributions made by the past and current students in my Theoretical and Computational Cell Biology Lab at the Ernest Mario School of Pharmacy, Rutgers University, toward developing the RASER model of enzyme catalysis. I am particularly grateful to Mr. Kenneth So who wrote the computer program for finding the best-fit blackbody radiation-like equation (BRE) based on the genome-wide RNA kinetic data. Glycolysis Pathway (18 RNA molecules) 3 Figure 6. A comparison between blackbody radiation and enzymic catalysis. (Left) Blackbody radiation involves promoting the energy levels (vibrational, electronic, or vibronic) of oscillators from their ground state E0 to higher energy levels, E1 through E5. The wavelength of the radiation (or quantum) absorbed or emitted is given by ΔE = Ei – E0 = hf, where Ei is the ith excited-state energy level, h is the Planck constant, f is the frequency, and ΔE is the energy absorbed when an oscillator is excited from its ground state to the ith energy level. Alternatively, blackbody radiation can be thought of as resulting from the transitions of electrons from one energy level to another within matter, e.g., from E1 to E0, from E2 to E0, etc. (Right) A single molecule of cholesterol oxidase (COx) is postulated to exist in n different conformational states (i.e., conformational substates of Frauenfelder et al. [8]) denoted here as Ci with i = 1 to n. Each conformational state (or conformer) is thought tocarry a set of sequence-specific conformational strains, or conformons, and can be excited to a common transition state (denoted as C‡) by thermal fluctuations, leading to catalysis [1, Section 12.12]. REFERENCES Time, min [1] Ji, S. (2012). Molecular Theory of the Living Cell: Concepts, Molecular Mechanisms, and Biomedical Applications, Springer, New York. See Sections 11 and 12. [1a]. Ji, S. (2000). Free energy and Information Contents of Conformons in proteins and DNA, BioSystems54, 107-130. [2] Murugan, A. et al. (2012). Statistical inference of the generation probability of T-cell receptors from sequence repertoires. ArXiv:1208.3925v1 [q-bio.QM] 20 Aug 2012. [3] Watson, S. J. and Akil, U. (1999). Gene Chips and Arrays Revealed: A Primer on their Power and Their uses, Biol. Psychiatry45, 533-43. [4] Lu, H. P., Xun, L. and Xie, X. S. (1998). Single-Molecule Enzymatic Dynamics, Science282, 1877-1882. [5] Garcia-Martinez, J., Aranda, A. and Perez-Ortin, J. E. (2004). Genomic Run-On Evaluates Transcription Rates for all Yeast Genes and Identifies Gene Regulatory Mechanisms, Mol Cell 15, 303-313. [6] Ji, S. and So, K. (2009). The universal law of thermal transitions applicable to blackbody radiation, single-molecule enzymology and whole-cell metabolism, Abstract B1, The 102nd Statistical Mechanics Conference, Rutgers University, Piscataway, N.J., December 13-15. [6a] Watson, S. J. and Akil, U. (1999). Gene Chips and Arrays Revealed: A Primer on their Power and Their uses, Biol. Psychiatry45, 533-43. [7] Ji, S. (2008). Modeling the single-molecule enzyme kinetics of cholesterol oxidase based on Planck's radiation formula and the principle of enthalpy-entropy compensation, in Short Talk Abstracts, The 100th Statistical Mechanics Conference, December 13-16, Rutgers University, Piscataway, N.J. [8] Frauenfelder, H., McMahon, B. H., Austin, R. H., Chu, K. and Groves, J. T. (2001). The role of structure, energy landscape, dynamics, and allostery in the enzymatic function of myoglobin, Proc. Nat. Acad. Sci. (U.S.)98(5), 2370-74. (4) The histogram (Figure 10) of the frequency vs. distance classes of the RNA trajectories belonging to a given metabolic pathway can be fit into a blackbody radiation-like equation (BRE), Eq. (3), that is similar in form to the Planck’s radiation equation, Eq. (2) [6]. (5) BRE has also been found to fit single-molecule kinetic data of cholesterol oxidase [4, 7] and protein stability data [2].