Download

1 / 32
320 likes | 443 Vues
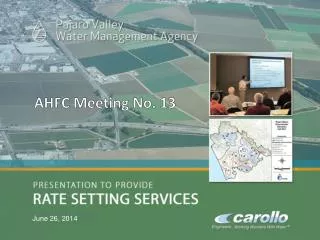
The AHFC Meeting No. 13, held on June 26, 2014, focused on the ongoing rate-setting process over a five-year outlook. Key agenda items included a recap of Meeting No. 12, a review of preliminary rate analysis, and discussions on cost allocation inputs and cost of service analyses. The meeting emphasized rate smoothing to manage future increases, outlined revenue requirements based on groundwater demand, and presented financing assumptions and demand conservation strategies. Next steps include finalizing these financial assumptions and progressing with rate design.

E N D
AHFC Meeting No. 13 June 26, 2014
Today’s Agenda • Recap of Meeting No. 12 • Overview of Preliminary Rate Analysis • Cost Allocation Inputs • Cost of Service Analysis • Next Steps
Rate Setting Process is for 5-yr period, but longer-term outlook is meant to smooth future rate increases
Revenue Requirements to be initially based on 51,700 AF (Groundwater) 51,700 AF is the 5-yr rolling average and consistent with existing rate/budget assumptions
Rate smoothing is preferred by AHFC, rather than larger initial increases Larger, Initial Increases Rate-Smoothing
Provisional assumptions were utilized to develop preliminary rates • Revenue Requirements Assumptions: • Rate Smoothing • BMP Funding (no other capital projects) • Financing Assumptions: • 1999 COP and 2007 COW debt refinancing • 2007 refinancing includes use of $12M in awarded Title XVI • $900,000 in grants • Demand Assumptions: • Groundwater demand of 51,700 AF • Conservation 500 AF per year until target is met • Delivered Water demand of 5,500 AF • 2010 Cost Allocation Methodology Foundation
Draft 2015 Cost allocation methodology remains consistent with the 2010 rate setting process and the findings of Pendry-Griffith
Initial Five Year Rate Impact under proposed increases (5% annual revenue increases) Inside DWZ vs. delivered water charge, difference is $97/af • Inside DWZ vs. outside DWZ, avg difference is $47/af Outside DWZ vs. rural residential, diff is $9/af *Rural Residential users charged 60% of an AF
Two critical guiding definitions to the Cost Allocation Analysis • Cost Allocations must be based on a quantifiable benefit, supported by system attributes and costs • Single Basin = Shared Challenges = Shared Solution • “All persons extracting water and paying the charge will benefit in the continued availability of usable groundwater.” - Pendry-Griffith Decision
Cost of Service Analysis used to allocate Revenue Requirements to rate categories Cost of Services Analysis
Changes to budget and water demands cause minor shifts from 2010 analysis
Various allocation bases used to distribute revenue requirements between functions
Various allocation bases used to distribute revenue requirements between functions
Initial Five Year Rate Impact under proposed increases (5% annual revenue increases) Inside DWZ vs. delivered water charge, difference is $97/af • Inside DWZ vs. outside DWZ, avg difference is $47/af Outside DWZ vs. rural residential, diff is $9/af *Rural Residential users charged 60% of an AF
Next Steps • Rate Design & Development (July) • Finalize revenue requirements based on ongoing refinements to financial assumptions • Potential clarity of grant and financial assumptions • Discussion of Proposition 218 Process (August)
Initial Five Year Rate Impact under proposed increases (5% annual increases)
Cost of Service Analysis is the method by which revenue requirements are allocated to each customer class
Revenue requirements are allocated to five unique service functions provided by the Agency (Functional Allocation)
Initial Five Year Rate Impact under proposed increases (5% annual revenue increases) Inside DWZ vs. delivered water charge, difference is about $115/af • Inside DWZ vs. outside DWZ, avg difference is about $45/af Outside DWZ vs. rural residential, difference is about $10/af *Rural Residential users charged 60% of an AF
Various allocation bases used to distribute revenue requirements between functions
Various allocation bases used to distribute revenue requirements between functions