
Predicting Interplanetary Magnetic Field (IMF) from Muon Data Analysis in Various Locations
This study investigates the prediction of Interplanetary Magnetic Field (IMF) components using normalized muon count data from different global patches. The analysis employs chi-square minimization to estimate IMF parameters, focusing on various configurations of data collection from specific locations. Outputs include comparisons of predicted Bx, By, and Bz values against observed data from different years, specifically examining the discrepancies post-correction for Compton-Getting anisotropy. Results aim to enhance accuracy in IMF predictions using cosmic ray data.

Predicting Interplanetary Magnetic Field (IMF) from Muon Data Analysis in Various Locations
E N D
Presentation Transcript
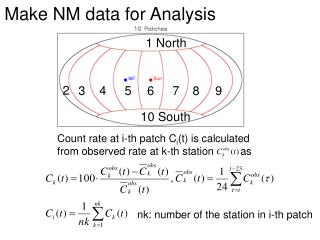
1 North 2 4 3 5 6 7 8 9 10 South Make NM data for Analysis Count rate at i-th patch Ci(t) is calculated from observed rate at k-th station as nk: number of the station in i-th patch
Predict IMF from NM data m, N: defined parameter An: defined from chi-square minimization • Input X: normalized NM count rate in the i-th patch Ci, i=1,10 or, deviation between i-th and j- th patch Ci,j=Ci-Cj, i,j=1,10 • Output B is compared with six types of IMF data • Bobs: Bx, By, Bz, dBx, dBy, dBz (dB(t)=B(t)-B(t-1)) by • normalized chi-square which defined as tn:number of the data in each year norm ~1: bad prediction <1: better prediction
Predicted Bz, dBz (2006) from Ci m N Number of data tn available in year 2006
Predicted (2006) from Ci,j=Ci-Cj j dBx Bx i dBy By dBz Bz m=1, N=1 m=1, N=5
Number of data tn available in year 2006 m=1, N=1 m=1, N=5
Predicted (2001) from Ci,j=Ci-Cj j i m=1, N=1 m=1, N=5
From muon data Nagoya Kuwait Hobart SaoMartinho m=1, N=5 m=1, N=1 m=1, N=5 m=1, N=1 m=1, N=5 m=1, N=1 m=1, N=5 m=1, N=1
From muon data (2006) m=1,N=1 m=1, N=1 m=1, N=1
From muon data (2006) m=1,N=5 m=1, N=5 m=1, N=5
Predicted (2006) from Ci,j=Ci-Cj j dBx Bx i dBy By dBz Bz m=1, N=1 m=1, N=5
Number of data tn available in year 2006 m=1, N=1 m=1, N=5 m=1, N=5 Num. of the gap needed to be 1/3*N
After data gap is filled j i m=1, N=5 m=1, N=5
Including CG anisotropy After correction of CG j i m=1, N=1 m=1, N=1
Including CG anisotropy After correction of CG j i m=1, N=5 m=1, N=5
For Muon data Number of data tn available in year 2006 m=1, N=1 m=1, N=5 After filling gap m=1, N=5
Correct Compton-Getting anisotropy %-deviation from 24-hour trailing average
Muon data After filling gap and correcting CG anisotropy Before j i m=1, N=5 m=1, N=5
Separate Toward and Away At time t+mΔt Bx > By → Toward Bx < By → Away
Toward m=1, N=1 m=1, N=5
Away m=1, N=1 m=1, N=5
Muon data Toward m=1, N=1 m=1, N=5
Muon data Away m=1, N=1 m=1, N=5
1 North 2 4 3 5 6 7 8 9 10 South 1 North 2 4 3 5 6 7 8 9 10 12 11 13 14 15 16 17 18 20 19 21 22 23 24 25 26 South
Toward m=1, N=1 m=1, N=5
Toward No CG correction m=1, N=1 m=1, N=1
Muon data Toward m=1, N=1 m=1, N=5
Toward Away 2006 m=1, N=1 m=1, N=1
Toward Away 2001 m=1, N=1 m=1, N=1


![Nm]](https://cdn3.slideserve.com/6300766/slide1-dt.jpg)