Download
1 / 38
380 likes | 496 Vues
LC Science Gang April 21, 2010 Doug Thomasey and Ashley Palmer. The Clear Complexity of Lake Conditions Through Herbivores and Mathematical Models. Goals of this Presentation. Introduce you to mathematical modeling Learn how to construct a model

E N D
LC Science Gang April 21, 2010 Doug Thomasey and Ashley Palmer The Clear Complexity of Lake Conditions Through Herbivores and Mathematical Models
Goals of this Presentation • Introduce you to mathematical modeling • Learn how to construct a model • Apply the idea of a model to some real world phenomenon, Timber Lake in Campbell County
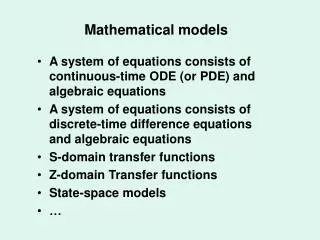
Mathematical Model • One or more equations used to describe the behavior of some system or phenomenon in mathematical terms. • Used in science, engineering, economics, and even psychology.
Where Models are used • Compound interest Liberal Arts Math • Carbon dating Pre-Calculus • Pendulum Trigonometry • Depth of water in a draining tank Calculus 1 • Population growth/Spread of disease Biology • Error Response Times Psychology • Dirt bike suspension systems Engineering
Suspension Dr. J. R. White, UMass-Lowell (Spring 1997)
Some Types of Models • Linear: y = mx + b • Quadratic: • Exponential: • Differential: www.szavay-blog.com
Parameters • Numerical values used in a model • Major influence on how model functions • Determined from observations (experiments) and assumptions about the system
Linear Model Parameters • In a Linear Model (y=mx+b), you have two ‘parameters’ m and b • When comparing temperature (°F °C) empirical evidence shows: 32°F= 0°C and 212°F= 100°C, so:
Scoring the DecathlonDay 1 – 100m, Long Jump, Shot Put, High Jump, 400mDay 2 – 110 hurdles, Discus, Pole Vault, Javelin, 1500m • Athletes are awarded points based on their PERFORMANCE in each of the 10 events • In a decathlon with 3 or more competitors, it is possible to win overall without winning any individual event. • Chasing points: • 100m: 11.00 – 861pts, 12.00 – 651pts (world record 9.58 - ) • PV: 14 ft – 693pts, 15 ft – 781pts (world record 20’2” - ) • 1500: 5:00 – 560pts, 4:30 – 745pts (world record 3:26.0 - ) 1202 1281 1218
What Type of Model is Used? • Linear? • No • An increase from 65’ to 70’ is much harder to achieve than and increase from 20’ to 25’, but yet the same increase in points would result.
Decathlon Model Running events • x, y, and z are set parameter values that change for each event. • These parameter values are the basis for the model to function. All other events
Long Jump Points Graph • An increase from 2.5 to 3m has a 50 pt increase • An increase from 6.5 to 7m has a 117 pt increase Wim Westera, Open Univ. of Netherlands
The Beauty of Modeling • World Record Holder in the Decathlon becomes
How? • Eventwise function • Piecewise function NEW WORLD RECORD!!! Doug Thomasey – 9,027 pts.
Differential Equation Models • Definition: an equation containing the derivatives or differentials of one or more dependent variables with respect to one or more independent variables • Change continuously with time
Constructing a model • 1) Identify the variables that are changing the system • 2) Set reasonable assumptions about the system (parameter values depend on these assumptions) • 3) Using any other empirical information, determine the DE or system of DE’s that would make up the model
Finding Parameter Values • Most of the time come through experiments or literature • Example: Death rate of a population represented by letter μ • If the death rate is low, then the value for μwill be small • If the death rate is high, then the value for μ will be high • Typically these values range from 0-1, based on a percentage
Visual Parameter Explanation μ =0.16 μ =0.8
Smith Mountain Lake Model • Problem at hand: Striped Bass infected with parasite, Achtheres. We want to determine how long it would take for the entire population to become infected (if ever) given that 1 infected fish is introduced to the population. We will also assume that there is no fish reproduction, once a fish is infected, it will always be infected, and that we will stock 21 fish per acre per year into the lake.
Smith Mountain Lake Model • s: susceptible fish • i: infected fish • b: encounter rate • d: death rate of susceptible • v: death rate of infected fish
Results from SML • Many factors can be solved algebraically • Equilibrium, reproduction numbers, etc. • Mathematical Software • Mathematica • Maple • Derive • Stella (Visual)
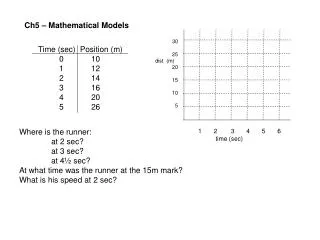
Results from SML • Y-axis: number of striped bass • X-axis: months after one infected fish is introduced
Death Rate Parameter • μ =0.25 • μ =0.75
Harder Model • 10 Parameter Values? • bx,η1,η2,η3,μ,ψ,β1,β2,α1,α2 • Use a separate computer program to create lists of possibilities www.math.hmc.edu
Timber Lake • Lacustrine system • 65 acres in area, or 26 hec-3045.6 m² • Soil type is mineral based and is mainly saturated especially along the shore lines of the lake itself • Vegetation coverage: Typha, Najasguadalupensis, Algae • Unconsolidated bottom
Formation of Timber Lake • Inflows: 3 separate streams flowing into the lake • Waterlick Brown Buffalo • Brown • Outflow: Spillway by the Dam
Concerns of Timber Lake • Phosphorus loading • Najasguadalupensis • Herbivores
Phosphorus and Clarity • Phosphorus is a nutrient required by all organisms for the basic processes of life. • Phosphorus is a natural element found in rocks, soils, and organic material. • Abundant amount of Phosphorus • Creates Eutrophic conditions • Lack of Phosphorus • Decreasing zooplankton population and plant life slowmuse.wordpress.com
Testing Clarity • Secchi Disk • Lowered into water, until it is no longer visible • After time, you are able to compare a reading to previous readings. • Turbidity
Difference in Clarity • Lake Tahoe • College Lake T. Shahady
Data Collected • Sampled March-December 2009 • Hydrolabreadings • Zooplankton collection • Phosphorus collection • Use Stella to Model the outlook for Phosphorus levels in Timber Lake • Determine parameter values from data collected
Managing Phosphorus • BMPs are the most sufficient way to go about the preservation of the lake. • Keep a close eye on septic tanks • Look into “lakescaping”- helps reduce fertilizers that may run into the lake. • Become familiar with development within your watershed that might inhibit the activity that goes on within your lake.
Keeping a lake clear is more complex than most people think….