Download
1 / 14
140 likes | 258 Vues
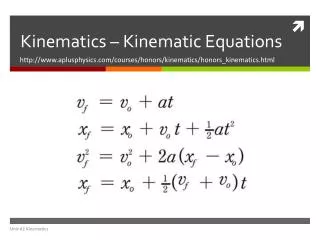
Tracking Eye Movements of Students Solving Kinematics Equations. Nick Oderio August 1 st , 2013 KSU REU 2013-PER. Theoretical Framework. The Multimedia Principle -people learn better from words and pictures than from words alone

E N D
Tracking Eye Movements of Students Solving Kinematics Equations Nick Oderio August 1st, 2013 KSU REU 2013-PER
Theoretical Framework • The Multimedia Principle-people learn better from words and pictures than from words alone • The Split-Attention Principle-people learn more deeply when words (written or narrated) and pictures are spatially and temporally integrated in a presentation. • The Modality Principle-people learn better when pictures are accompanied by narration than when they are accompanied by written text • Mayer 117-59
v(t) (m/s) 120 20 vf t (s) t (s) (0,0) (0,0) 10 10 The motion of an object along a straight horizontal path is shown by the graphs below. Determine the velocity of the object at 10 seconds. x(t) (m)
x(t) (m) v(t) (m/s) 200 25 vf 40 t (s) t (s) (0,0) (0,0) 10 10 The motion of an object along a straight horizontal path is shown by the graphs below. Determine the velocity of the object at 10 seconds. Displacement is equal to the area under the (v-t) graph. Area under the (v-t) graph = Area of triangle + Area of rectangle Area = ½ (base)(height) + (base)(height) = ½ (10) (25 - vf) + (10) (vf) Displacement, x = 200 m – 40 m = 160 m from (x-t) graph. 3) Equate the answer of (1) and (2) to get vf=7.0 m/s .
v(t) (m/s) a (t) (m/s2) 30 t (s) t (s) (0,0) (0,0) 5 5 The motion of an object along a straight horizontal path is shown by the graphs below. Determine the displacement of the object. Find area under the (a-t) graph Area = Area of Pink Rectangle + Area of Brown Rectangle vf 200 Area=5(30)+5(10) Change in velocity, v = vf – 50 m/s 10 50 Area = 200 m/s 10 10 Change in velocity from (v-t)graph Area under the (a-t) graph = vf – 50 m/s =200 m/s vf = 250 m/s
Correctness Data Analysis • Chi Squared Test • Shows whether or not there is a significant difference in students’ performance between any two problems • If p < 0.05 then the difference is significant • If the difference is significant, then we look at the “Cramer v” • Higher values for v mean a more significant change • Example: Pb(1-5) • Χ2 (1, 88) = 6.984, p = 0.016, v = 0.282
Correctness Data * * * * = significant difference when compared to respective initial problem
Correctness Data * = significant difference
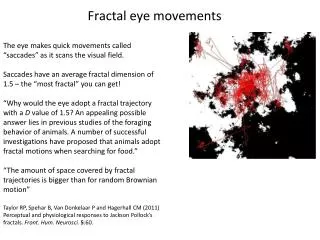
Future Work • Completely analyze and interpret eye movement data • There is improvement over time from the initial static problem • Integrate eye movement data with correctness data
My Sincere Thanks To. . . • Dr. Sanjay Rebello • Elise Agra (graduate student) • Dr. Neelam Khan (visiting professor) • Amy Rouinfar (graduate student) • Dr. Kristan Corwin • Dr. Larry Weaver
Work Cited Mayer, R. E. The Cambridge Handbook of Multimedia Learning. New York, NY: Cambridge UnivPr, 2005. 117-59. Print.