Download
1 / 14
140 likes | 243 Vues
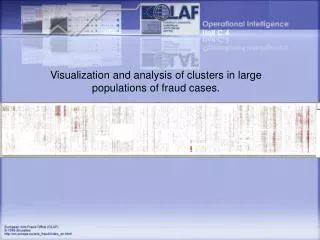
Analyzing undervaluation clusters in EU textile imports to detect fraud patterns and evaluate countermeasures effectiveness. Visualizing shifts between member states and identifying organized behaviors across borders.

E N D
Visualization and analysis of clusters in large populations of fraud cases.
The fraud: • Textiles, mainly from Asian countries are declared with as low as one tenth of their real value -> Evasion of ad valorem duties: Declared value: 0.2$ x 30,000 Units = 6,000$ x 12% = 720$ (scanned orig. invoice) During the investigation, sources speak of as many as 40,000 containers Actual Value: 2$ x 30,000 Units = 60,000$ x 12% = 7,200$
The task: • Identify all potential cases of undervaluation in the 27 EU Member States using the declared average unit prices; • Create an overview of clusters of cases in order to • identify shifts between EU Member States; • evaluate the effectiveness of counter measures taken by Member States; • identify any organized behaviour across Member States.
The problem: • Several statistical methods could identify these cases as outliers (e.g. t-test), but: Fraud appears to be so widespread that it biased the declared average unit prices over time Example: Unit Prices for imported T-Shirts, by 27 EU-MS Workbook: TableauPresentation.tbw / Worksheet: Unit-Prices 610910 EU27
Comparison between Unit Prices declared during export in China and import inCzech Republic Solution: Chinese export unit prices seem to be reliable Workbook: TableauPresentation.tbw / Worksheet: Comparison Unit Prices CN MS05
Description of the data set: • Contains import declaration data for four chapters with textile goods of the Combined Nomenclature: 61, 62, 63 and 64 • Date aggregation level: Day • Starting from Jan 2007, last update Mai 2009 • More than 6M records • Possibility for daily updates (monitoring function) • Contains: Product Codes, Customs Procedures, Member State, Third Country, Volume, Statistical Value and Average Unit Value
Analytical approach: • The ‘lowest acceptable unit value’ is calculated: average minimum values minus standard deviation over time (as declared at Chinese export) • Differences between this value and the declared unit value are calculated
Visualization: • PERIOD set to ‘All Values’ • Shape of the marks set to Country of Origin • Colour of the marks represents percentage of import values to export values: • Red to pale brown -> Below 100% • Pale brown to green -> Above 100% Period Workbook: TableauPresentation.tbw / Worksheet: Sample Import Database Product Codes
Visualization: • Filter on DIFF_PCT (Difference in %) set < 100% Period Workbook: TableauPresentation.tbw / Worksheet: Sample Import Database Filtered Product Codes
Visualization: Overview all Member States Question 1: Can we identify clusters of cases?
Event: Member States were informed regarding fraud cases Event: Mission to CZ, risk profile is introduced Event: Risk profile in DE is adapted Question 2: Can we see shifts between Member States? Workbook: TableauPresentation.tbw / Worksheet: Shift MS05 – MS06
Question 2: Can we see shifts between Member States? Workbook: TableauPresentation.tbw / Worksheet: Product611211
Overview of all Member States combined, by Product Code Question 3: Can we identify an organized behaviour? Workbook: TableauPresentation.tbw / Worksheet: Overview Total
Other Findings: Differences between Member States regarding the distribution of unit values per volume -> Effect of differently designed risk profiles Workbook: TableauPresentation.tbw / Worksheet: Price per MS all Products