Download
1 / 20
210 likes | 360 Vues
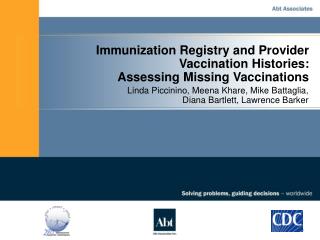
T. Immunization Registry and Provider Vaccination Histories: Assessing Missing Vaccinations. Linda Piccinino, Meena Khare, Mike Battaglia, Diana Bartlett, Lawrence Barker. T. NIS REGISTRY DATA QUERY STUDY.

E N D
T Immunization Registry and Provider Vaccination Histories:Assessing Missing Vaccinations Linda Piccinino, Meena Khare, Mike Battaglia, Diana Bartlett, Lawrence Barker
T NIS REGISTRY DATA QUERY STUDY • Study integrated registry query consent question into standard National Immunization Survey (NIS) interview • Four mature registry sites participated in the study • Each site had one quarter of data collection (one site in Q3/2002, three sites in Q4/2002) • Vaccination history data obtained from NIS provider reports and from state/local registries for children with parental consent
T RESEARCH PROBLEM • Need a way to assess the quality of vaccination data for NIS children with data available from both NIS provider reports and immunization registries
T OBJECTIVES OF THIS ANALYSIS • To compare vaccination histories obtained from immunization providers and registries for a sample of NIS children 19-35 months old • To examine the pattern of missing vaccination data by vaccination type, dose and source of data • To help identify subgroups of children where immunization data were more likely to be absent, by characteristics associated with the children and their provider types
T ANALYSIS GROUPS • Analysis sample universe is NIS children with both registry and provider data • Data are combined for four sites because of sample size and confidentiality concerns • Analysis universe broken into two subgroups within a vaccine type for children that have: • provider-reported data but have some missing registry data • registry-reported data but have some missing provider data
T METHODOLOGY FOR IDENTIFYING MISSING VACCINATIONS • 323 children with registry vaccination data and adequate provider data in the NIS • Focus on DTaP vaccinations present in one source but missing from the other source • Children with 4 doses of DTaP in the provider data (N = 245) but fewer than 4 doses in the registry data (N = 75) • Children with 4 or more doses of DTaP in the registry data (N = 180) but fewer than 4 doses in the provider data (N = 16) • Determine dose number (order) of missing vaccination(s)
T DETERMINING THE DOSE NUMBER OF MISSING VACCINATIONS • Provider data: (1) 2/15/2001 (2) 8/12/2001 (3) 1/14/2002 (4) 9/03/2002 • Registry data: 2/15/2001 1/16/2002 8/30/2002 • For each registry vaccination date, determine which provider vaccination date is closest in time. • DOSE 1 MISSING DOSE 3 DOSE 4
T CHILDREN WITH MISSING DTaP DOSES IN THE REGISTRY DATA • 75 CHILDREN (30.6%) 10.7% MISSING MISSING MISSING MISSING 8.0% MISSING MISSING MISSING DOSE 4 9.3% MISSING MISSING DOSE 3 DOSE 4 2.7% MISSING DOSE 2 MISSING MISSING 1.3% MISSING DOSE 2 DOSE 3 MISSING 6.7% MISSING DOSE 2 DOSE 3 DOSE 4 6.7% DOSE 1 MISSING MISSING MISSING
T CHILDREN WITH MISSING DTaP DOSES IN THE REGISTRY DATA (continued) 6.7% DOSE 1 MISSING MISSING DOSE 4 5.3% DOSE 1 MISSING DOSE 3 MISSING 6.7% DOSE 1 MISSING DOSE 3 DOSE 4 6.7% DOSE 1 DOSE 2 MISSING MISSING 8.0% DOSE 1 DOSE 2 MISSING DOSE 4 21.3% DOSE 1 DOSE 2 DOSE 3 MISSING 100.0%
T SUMMARY OF MISSING REGISTRY DOSES • 38.7% have first dose missing • 53.4% have second dose missing • 49.5% have third dose missing • 54.7% have fourth dose missing
T SUMMARY OF MISSING REGISTRY DOSES (continued) • 42.7% have one dose missing • 29.3% have two doses missing • 17.4% have three doses missing • 10.7% have four doses missing
T CHILDREN WITH MISSING DTaP DOSES IN THE PROVIDER DATA • 16 CHILDREN (8.9%) 6.3% MISSING MISSING MISSING DOSE 4 12.5% MISSING MISSING DOSE 3 DOSE 4 6.3% DOSE 1 MISSING MISSING MISSING 18.7% DOSE 1 MISSING DOSE 3 DOSE 4 6.3% DOSE 1 DOSE 2 MISSING MISSING 50.0% DOSE 1 DOSE 2 DOSE 3 MISSING 100%
T SUMMARY OF MISSING PROVIDER DOSES • 18.8% have first dose missing • 43.8% have second dose missing • 18.9% have third dose missing • 62.6% have fourth dose missing
T SUMMARY OF MISSING PROVIDER DOSES(continued) • 68.7% have one dose missing • 18.8% have two doses missing • 12.6% have three doses missing • 0.0% have four doses missing
T REASONS FOR MISSING PROVIDER DOSES • 23 children had more registry doses than provider doses when all vaccines were examined – We reviewed the IHQs and recontacted the providers when necessary. • Extra registry vaccination dose(s) very close to another vaccination date • Extra registry dose is most recent dose and is after the last provider-reported vaccination date and was left off the IHQ; or, that dose was administered by a new provider who failed to respond to NIS provider survey • Extra registry dose is notthe last dose and was inadvertently omitted when the IHQ was filled out • The child has multiple providers but respondent only identified one provider • Not all identified providers responded or returned the IHQ with vaccination data
T CHARACTERISTICS OF CHILDREN WITH MISSING DTaP DOSES
T IMPLICATIONS FOR DATA QUALITY • INCOMPLETE VACCINATION HISTORIES • Even though immunization history data for this group of children are available from both NIS providers and registries, the histories are not always complete. • For children with data from both sources: For those children with 4 provider doses of DTaP, about 31% of children had one or more doses missing in the registry data. For those children with 4 registry doses of DTaP, only about 9% of children had one or more doses missing from the provider reports. This suggests that registry histories tend to be more incomplete than provider histories.
T IMPLICATIONS FOR DATA QUALITY • MIXED PATTERN OF MISSING DATA • The frequency and order of the missing doses for DTaP vary by source of data. Therefore, source of data should be considered when interpreting results and making estimates. • The fourth DTaP dose was the most likely to be missing in both the provider and registry data, although the reasons this 4th dose is missing might differ by data source.
T IMPLICATIONS FOR DATA QUALITY • SPECIAL SUBGROUP ISSUES • Children with multiple providers were more likely to be missing some provider doses, while • Children with only private providers were more likely to be missing some registry doses • Children in households where shot cards were not used in the NIS interview were more likely to have some missing provider doses • Providers that were not identified by respondents might also be responsible for some of the missing data
T CONCLUSION • Conclusions are guarded because analysis based on small sample size. Results show a mixed pattern of missing doses; this might become clearer with a larger sample size. • Data quality concerns suggest that building combined “best value” estimates may be difficult since the quality and completeness of registry data are lacking (although some registries are better than others in these respects).