Download
1 / 30
300 likes | 415 Vues
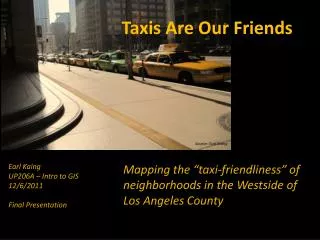
Taxis Are Our Friends. Mapping the “taxi-friendliness” of neighborhoods in the Westside of Los Angeles County. Source: Earl Kaing. Earl Kaing UP206A – Intro to GIS 12/6/2011 Final Presentation. Introduction. Source: D.L. Scrimger. The Urban Agenda.

E N D
Taxis Are Our Friends Mapping the “taxi-friendliness” of neighborhoods in the Westside of Los Angeles County Source: Earl Kaing Earl Kaing UP206A – Intro to GIS 12/6/2011 Final Presentation
Introduction Source: D.L. Scrimger
The Urban Agenda • Once someone is forced to buy a car, it’s all over: the private automobile is a huge investment; and once you sink money into that investment, the marginal costs (both real and perceived) of driving are almost negligible. In other words, when you own a car, there really is no incentive to seek out—or politically support—alternatives. • To move away from auto-dependency, we need to prevent that first purchase: If we want to move away from auto-dependency, we need to build political support for the kind of policies needed to make walking, bicycling, and public transit more viable alternatives. And to build this political support, we need to prevent that first purchase. We have to make it at least possible, if not easy, to live without owning a car. • The taxi industry makes it possible to live in an auto-centric world, without having to own your own car. If we can expand the number and variety of trips that can be effectively served by taxis, the dramatic difference in quality of life separating the car-dependent from the car-free narrows. As the gulf narrows, more and more people are able to make that leap away from auto-dependency—to live rich and full lives on foot, by bike, on transit, and –every so often--in a taxi. • The newly liberated expand the realm of what is politically possible: more compact, dense development; the widening of sidewalks; charging the right price for parking; policies which finally put people first; closing off downtown streets every single day of the week instead of once or twice a year! The possibilities are endless.
Research Goal Goal : Expand the number and variety of trips that can effectively be served by taxis in Los Angeles, with the goal of supplementing—not replacing—trips on foot, bike, and transit Taxicab Economics 101 • [Cost of Taxi Service] = f (distance, time, deadheading costs) • In current system, customers pay a distance/time based rate that factors in an “average” deadheading cost—the cost of returning from a destination without passengers • Deadheading costs are a SIGNIFICANT! A 4-mile trip from Westwood to Bel-Air costs more for a taxi driver to serve than a 4-mile trip from Westwood to Santa Monica, but they are priced exactly the same! Midterm Research Question: What if we could identify zones in Los Angeles where the deadheading costs are low? In other words, where the taxi driver is very likely to be able to find a return fare? Final Research Question: What would a network of taxi-friendly nodes in Los Angeles look like? Where would the nodes be located, and how much would it cost to travel between these nodes? Imagine getting picked up in the center of Westwood Village and dropped off in the middle of West Hollywood—all for $10!!!
Neighborhoods of the Westside 18 neighborhoods Generally bounded by the Pacific Ocean to the West, Fairfax to the East, the Santa Monica Mountains to the North, Manchester to the South Average Median Household Income: $67,000 Intersected by two major highways Map prepared by Earl Kaing Data Source: LA Times, 2000 Census, LA County CIO
For the Midterm… • Commercial Taxi Friendliness • Commercial Density Score • % Multi-Unit Housing Score • Residential Taxi Friendliness • Commercial Rent Score • Median HH Income Score Maps prepared by Earl Kaing Data Source: LA Times, 2000 Census, LA County CIO, LA County Assessor
For the Final… For the final, I will: • Use Map Algebra to consolidate the maps of residential and commercial taxi friendliness into a single map • Use Geocodingto place a taxi stand at each area of taxi friendliness based on qualitative / experiential knowledge of areas that are pedestrian friendly • Use Service AreaAnalysis Determine how many people live within 15 minutes walk, and 15 minutes bicycling of each taxi stand • Create an O-D Matrix to estimate the expected fare between each taxi stand 4. O-D Matrix 3. Service Area 1. Map Algebra 2. Geocoding
findings Source: D.L. Scrimger
Taxi Friendliness Components Commercial Taxi Friendliness Residential Taxi Friendliness [Residential Taxi Friendliness] = [% Multi-Unit Housing Quintile] + [Median HH Income Score*] *See appendix for calculation [Commercial Taxi Friendliness] = [Commercial Density Quintile] + [Commercial Rent Quintile] 4. O-D Matrix 3. Service Area 1. Map Algebra 2. Geocoding Maps prepared by Earl Kaing Data Source: LA Times, 2000 Census, LA County CIO, LA County Assessor
Aggregate Taxi Friendliness [Aggregate Taxi Friendliness] = [Commercial Taxi Friendliness] + [Residential Taxi Friendliness] 4. O-D Matrix 3. Service Area 1. Map Algebra 2. Geocoding Maps prepared by Earl Kaing Data Source: LA Times, 2000 Census, LA County CIO, LA County Assessor
Taxi Stand Locations 1 4 5 2 3 6 4. O-D Matrix 3. Service Area 1. Map Algebra 2. Geocoding Map prepared by Earl Kaing Data Source: LA Times, 2000 Census, LA County CIO, LA County Assessor Image Sources : Google Street View
Service Area (Walking) 4. O-D Matrix 3. Service Area 1. Map Algebra 2. Geocoding Map prepared by Earl Kaing Data Source: LA Times, 2000 Census, LA County CIO
Service Area (Bicycling) 4. O-D Matrix 3. Service Area 1. Map Algebra 2. Geocoding Map prepared by Earl Kaing Data Source: LA Times, 2000 Census, LA County CIO
3. Service Area 4. O-D Matrix 1. Map Algebra 2. Geocoding A Comparison of Estimated Fares Traditional Taxi Awesome Taxi Map prepared by Earl Kaing Data Source: LA Times, 2000 Census, LA County CIO Fare Data: taxifarefinder.com
3. Service Area 4. O-D Matrix 1. Map Algebra 2. Geocoding Potential Flat Fare Structure
Questions? Source: D.L. Scrimger
Requirements Checklist appendix
Step-by-Step Methods appendix
Communities of the Westside • Took a JPEG of Westside Region from Mapping LA website • Georeferenced JPEG to give it coordinates • Usedgeoreferenced as basis to create a new shapefile by editing the unofficial LA County communities shapefile to match the Mapping LA JPEG • Included the neighborhood of West Hollywood in my definition of the Westside, even though it’s not included by the Mapping LA project • Used new shape file to determine which census tracts to consider in analysis. Any census tracts which intersected a Westside neighborhood was included. All other tracts were clipped away.
Map Algebra • Combine the separate residential and commercial taxi friendliness maps into a single taxi friendliness map. • Used a model to convert residential shape file and commercial shape file into four separate rasters • Used model to reclass each rasters. All were reclassed based on quintiles, with the exception of income, which I reclassed based on standard deviations from the average median income on The Westside • Used Map Algebra > Raster Calculator to add the two residential rasters to get a residential index. Repeated process with the commercial rasters to get a commercial index. • Added the two rasters together to create an aggregate taxi friendliness index 4. O-D Matrix 3. Service Area 1. Map Algebra 2. Geocoding
Model 4. O-D Matrix 3. Service Area 1. Map Algebra 2. Geocoding
Metadata 4. O-D Matrix 3. Service Area 1. Map Algebra 2. Geocoding
Taxi Stand Locations • For each neighborhood, determine the best location to place a taxi stand. • Using the raster of taxi friendly census tract, I classified out of a total possible friendliness score of 20, those in the 90-100%, 80-90%, 70-80%, and 60-80% range. • Based on the raster, I identified unique clusters of 90-100% taxi friendliness within each neighborhood. Most neighborhoods had one distinct cluster, but some, like Santa Monica, had two. • I used Google maps, along with qualitative and experiential knowledge to identify specific cross streets for the taxi stands. I was looking for locations that were human-scale and pedestrian friendly. • Based on this analysis, I identified the following areas: • Santa Monica: SMB & 4th • Sawtelle: Sawtelle and Olympic • Venice: Abbot Kinney & Westminster • West Hollywood: San Vicente & SMB; Martel & SMB • Westwood: Weyburn and Broxton; Westwood and Strathmore • I used the Tigerroads shape file for Los Angeles, clipped to the Westside, and created an address locator based on it. The roads have dual ranges. • I then used this address locator to geocode the locations I had identified as most appropriate for a taxi stand. • For this layout, I included pictures of the intersection where the stand will be located, for visual reference. 4. O-D Matrix 3. Service Area 1. Map Algebra 2. Geocoding
Service Area Create a service area to see who is 5, 10, 15 minutes away from the stand on foot, and by bike. • I calculated a segment length for each road feature in the tiger roads shape file. • I then calculated impedence = [length] / [speed] for driving, biking, and walking, where I assumed: • average driving speed across the entire network of 25 mph (DMV speed limit in all business/residential districts unless otherwise posted) • average walking speed of 3 mph • average biking speed of 15 mph • Next, I created a network dataset using the updated tiger roads file • I then used spatial analyst to create a service area analysis layer for walking and biking. What area is within 5, 10, and 15 min walking or biking of the taxi stand? How many people live within 15 minutes walk or bike of each taxi stand? • Dissolve the 5, 10, and 15 minute service areas into a single buffer layer. • Join the buffer layer with the census data layer containing information about population per census tract • Extract information based on spatial location, to sum up the population of all census tracts which intersect the buffer • Estimate the population within the buffer only using a factor = [area of buffer] / [total area of all census tracts which intersect buffer] • Repeat this for both the walking and the biking service area. • Represent taxi stand access with graduated symbols based on population served. 4. O-D Matrix 3. Service Area 1. Map Algebra 2. Geocoding
3. Service Area 4. O-D Matrix 1. Map Algebra 2. Geocoding O-D Matrix Estimate cost of service between each node • Use network analyst to calculate an O-D matrix for the network. • If we assume current prices are twice as high as they need to be because of deadheading, then the new rate per unit time/distance for this new proposed schematic can be divided by two • I use taxi fare calculator available online to see what the rate would be under current price regime. It turns out taxi trips average about $1.6 per minute. Thus the new price would be $0.8 per minute. • Calculate the new cost, using the driving time (minutes) between each node from the O-D matrix