Download
1 / 21
210 likes | 382 Vues
Development of a database of intensively monitored groundwater systems in Australia. Barry Croke National Centre for Groundwater Research and Training Australian National University. Personal background. Undergrad: Theoretical Physics (but also covered core material of Experimental Physics)

E N D
Development of a database of intensively monitored groundwater systems in Australia Barry Croke National Centre for Groundwater Research and Training Australian National University
Personal background • Undergrad: Theoretical Physics (but also covered core material of Experimental Physics) • PhD: Astrophysics • Currently working in the Integrated Catchment Assessment and Management Centre (part of the Fenner School of Environment and Society) and the Department of Mathematics. • Expertise in data analysis, and modelling natural systems
NCGRT • Federally funded joint venture including researchers in various aspects of groundwater management • 12 universities and 8 industry and government organisations • http://www.groundwater.com.au/
NCGRT 5 Programs • Innovative Characterisation of Aquifers and Aquitards • Hydrodynamics and Modelling of Complex Groundwater Systems • Surface Water – Groundwater Interactions • Groundwater-Vegetation-Atmosphere Interactions • Integrating Socioeconomics, Policy and Decision Support
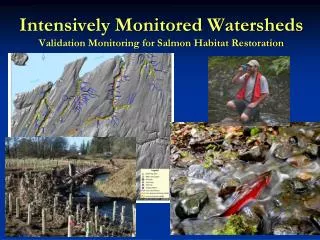
Super Science Project • 5 field sites, with intensive monitoring to improve understanding of the behaviour of groundwater systems. This includes monitoring of climatic variables, vegetation response as well as groundwater levels and concentrations • Wellington (NSW) • Namoi (NSW) • Ti Tree (NT) • Willunga (SA) • North Stradbroke Island (Qld)
ANU’s role • Creation and maintenance of central database • Store raw data, processed data and meta-data • Develop methods for conducting quality assurance checks • How to automate this process, and ensure reliability • Design of web portal for access to database • Ensuring easy access to different types of data: time series, spatial maps, weather radar data • Methods of visualising data
Hardware • Access to Maths cluster for computational load • 272 cores through a single head node and 32 blades • 20TB storage (41TB on some nodes) • 16GB RAM/node (64GB on head node)
Hardware • Access to central computer system being developed by the Division of Information at ANU • Primarily for database storage and web access
Software Database • We are going to be using PostgreSQL with PostGIS extension. • Natively supports GIS data and spatial queries. • Open source, multi-platform. Server: • GeoServer with the AuScope developed App-Schema extension.
Spatial Information Services Stack • Initially developed as part of AuScope Grid to provide a quite of tools for spatial data interoperability within the geoscience community. • To achieve full interoperability, Open Geospatial Consortium (OGC) standards are only the beginning. • The various services defined in the Stack provide a vessel to enable interoperable data exchange. • https://www.seegrid.csiro.au/wiki/bin/view/Siss/SISSChapter3
Support queries via OGC web services: Web Feature Service (WFS)WFS provides XML formatted data with spatial primitives. Web Coverage Service (WCS)WMS provides grid raster data in GeoTIFF and NetCDF formats. Web Mapping Service (WMS)WMS provides images, including server-side rendered images of WFS layers.
Software WFS returns XML conforming to OGC’s Geography Markup Language (GML) specification. This mostly defines the way point, curve and surface information is described. Simple Schema • At its simplest, it is an XML representation of a database table. Each row is returned as an XML entry, with database columns returned as child items and the geographic shape.
e.g. simple feature with flat data • OGC compliance level SF-0 • Ease of configuration and high performance • Cost is limitation in interoperability
Software Complex Schema • These represent multiple objects with relationships and hierarchies. This capability is provided by AuScope's App-Schema plugin. • The prime example of this is GeoSciML, which describes geosciences information. This has been extended by others to meet more specific needs, such as: • GWML: Groundwater Mark-up Language • ERML: Earth Resources Mark-up Language • CSML: Climate Science Mark-up Language • BoM’s Water Data Transfer Format (WDTF) is the currently mandated format for delivery of water information by various organisations to the Bureau. It is based on GML and the OGC Observation and Measurement spec. There is a push to harmonise WDTF with WaterML (used widely in the U.S.) to create WaterML2.0
e.g. complex feature with links to nested data • OGC compliance level SF-1 • Multiple tables per feature
Software Catalogue/Registry:GeoNetwork is a spatially-aware directory of the services we provide. Vocabulary Service: This provides common definitions of concepts, allowing hierarchies of classifications and links to definitions.
Challenges • Design of databases is fairly straight forward, and there are existing examples • QA is a vital component. Need to be able to rapidly assess incoming data, and contact provider if there are potential problems • Needs to be as automated as possible, and be able to handle a wide range of data types • Compare between different datasets, and with models • Ability to learn from feedback?
Challenges • Underlying web portal software is available (SISS) • Need to develop suitable tools for extracting data and also data visualisation, linking together different data sources (needs to be able to handle different temporal and spatial resolutions)