Download
1 / 18
180 likes | 347 Vues
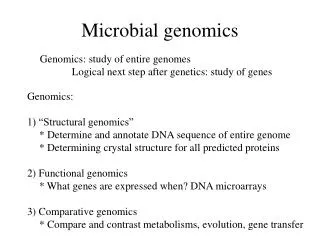
Genomics Technology to Assessing Microbial Activity in the Environment. MICRO ARRAY TECHNOLOGY. Array technology and how it works How it is likely to be applied and the implications What WILL be gained from its application Advantages and cost benefits. Diverse Chemicals and Microorganisms.

E N D
Genomics Technology to Assessing Microbial Activity in the Environment
MICRO ARRAY TECHNOLOGY • Array technology and how it works • How it is likely to be applied and the implications • What WILL be gained from its application • Advantages and cost benefits
Diverse Chemicals and Microorganisms • 10 x 106Chemicals • 8 x 10⁶Xenobiotic • 1 x 10⁶Recalcitrant • 0.4 x 10⁶ traded at over 50 tonnes per year • Toxicological/ biodegradative data on only around 5000-6000 • MICROORGANISMS IN COMPLEX COMMUNITIES IN THE ENVIRONMENT • Difficult to assess their effectiveness • Some cannot be cultured
Most of the biomass, and most of the diversity is here – there are many missing branches… You are here… The ‘tree of life’ rRNA sequence-based phylogenetic tree
Microbial community Pure cultures Nucleic acids Whole Cells ‘Richness’ (number of unique taxa) ‘Evenness’ (relative abundance of each taxon) Clone library Amplified DNA FISH / microarray Molecular fingerprinting Gene probe DNA sequencing Sequence database Assessing microbial diversity • These are all nucleic acid (principally rRNA or rDNA) based methods. More direct, analytical methods • (ie. FAME analysis / MS fingerprinting) can also be used to estimate diversity. • These address only diversity (“Who’s there?”) and not metabolic potential or activity – unless • metabolic genes or their transcripts are targeted by gene probes etc.
Slide or membrane base Overview of array technology for environmental samples Environmental sample: Extract total DNA or RNA. Use PCR to amplify gene copies (convert RNA to DNA with reverse transcriptase) and apply fluorescent dye label Robotic arraymaker makes many multigene arrays. The genes present hybridse to their counterparts on the array and can be detected. Use laser fluorescence reader to scan slide. Two dyes can be used. One to target genes that identify the bacteria and the other to detect active biodegradation genes. Hybridise to complimentary sequence in array
Preparation of a DNA Microarray Robotic arm compresses micro samples onto slide Silylated Slides have reactive aldehyde groups and covalently bind tissue, cells or single or double-stranded DNA directly to the glass surface of a high quality microscope slide via the Schiff base aldehyde-amine chemistry (lysine residues of proteins, primary amines of DNA bases, or via synthetic DNA bases bearing amino-modifications). DNA samples may be 1. Oligonucleotides 2. Clones 3. Total DNA 4. PCR products
OR RNA Extract total DNA Reverse Transcriptase to give DNA Complex community of microorganisms Sample Preparation and hybridisation PCR to amplify target gene copies Hybridise to complimentary DNA on the array and wash off excess
SLIDE PLACED IN AUTOMATED LASER READER OR other chromogenic labelling method Dual labelled fluorescence that can be quantified DATA LOGGED ON COMPUTER Reading a DNA Microarray after hybridisation
A ‘DNA microarray’ 20,000 features, printed at 170µm pitch. Spot diameter approx 145µm. A different DNA ‘probe’ can be printed on each spot
Primary structure (sequence) and secondary structure (folding, loops etc) dictate tertiary (3D) structure of ribosome ribosome Bacterial SSU rRNA variability map; red = highly conserved
27f primer V1 V2 V3 V4 V5 V6 V7 519r primer Highly conserved sequence Variable sequence 16S rDNA gene • ~1500bp gene - encodes 16S (small subunit) rRNA molecule • Parts of the sequence are conserved among all living things • Central metabolism – inherited from the ‘last common ancestor’ • 40000+ sequences in the ‘Ribosomal Database Project’ DB • Conserved ‘blocks’ can be exploited to ‘amplify’ the gene in vitro • Variable regions are used for taxonomy – ‘phylogenetics’
How it is likely to be applied and the implications. • Large amount of gene sequence data • Estimated 10 years worth now added in 10 weeks! • Gene expression studies • e.g. New drug targets sought • Rapid detection of pathogenic bacteria and viruses from complex samples • Organisms detected AND their active genes • Rapid detection of biodegrading bacteria in the environment • “NO SINGLE AREA OF BIOSCIENCES WITH REMAIN UNAFFECTED BY THIS TECHNOLOGY” (Recent US government report)
What will be gained from its application? • For the first time it will be possible to analyse a complex microbial population and its relative performance in a SINGLE step. • The implications are enormous! • This will become the standard diagnostic tool • Legislation will follow on from this development • THE DESIGN AND SUITABILITY OF THE ARRAYS WILL BE THE MAIN LIMITING STEP IN APPLICATIONS
Variability in dioxygenase genes in the Rhodococci (unpublished data)
Advantages and cost benefits • Revolutionises environmental analysis • Analysis of MANY organisms / genes handled in single step. • DNA/RNA extracted on site can remain stable • High throughput back at the laboratory within one day • Fluorescence methodology is sensitive and quantitative • We can take advantage of our existing databases and expertise