Download
1 / 1
10 likes | 87 Vues
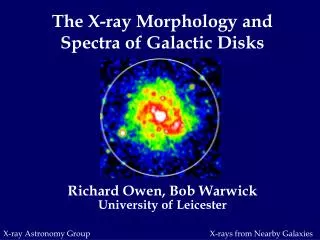
Parameters kT (keV) 0.7 (0.5 – 0.9) Abundance 1.1 (0.4 – 2.5) log nt (cm -3 s) 10.4 (10.1 – 11.9) N H (x10 22 cm -2 ) 7.4 (6.2 – 9.0) Flux (ergs cm -2 s -2 ) ‡ 9.7x10 -14. G11.0+0.0 G25.5+0.0 G26.6-0.1 G28.6-0.1

E N D
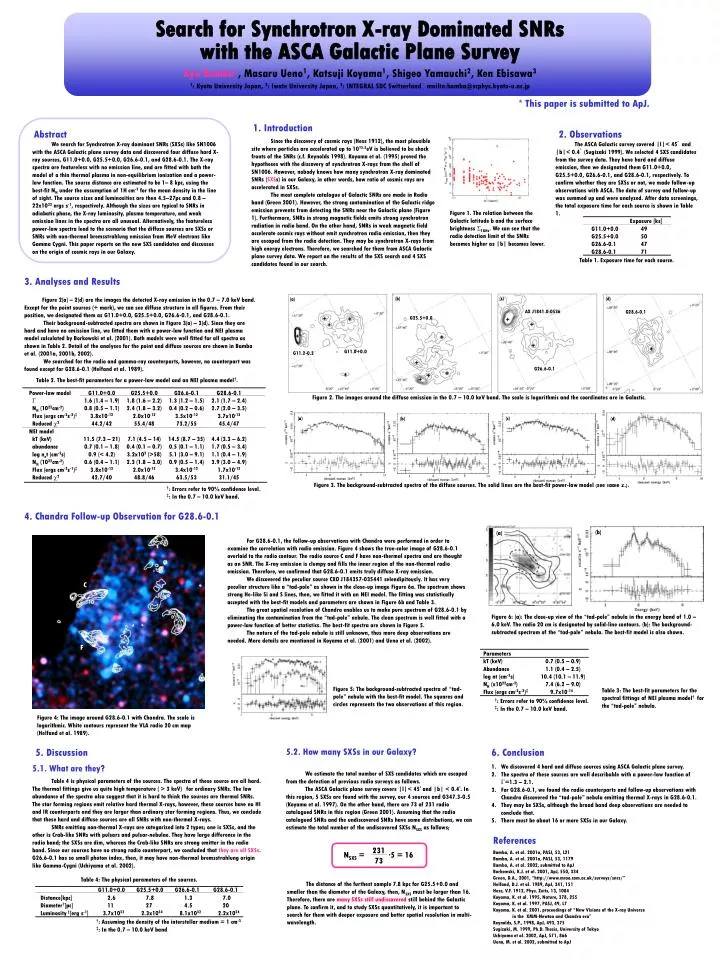
Parameters kT (keV) 0.7 (0.5 – 0.9) Abundance 1.1 (0.4 – 2.5) log nt (cm-3s) 10.4 (10.1 – 11.9) NH (x1022cm-2) 7.4 (6.2 – 9.0) Flux (ergs cm-2s-2)‡ 9.7x10⁻¹⁴ G11.0+0.0 G25.5+0.0 G26.6-0.1 G28.6-0.1 Distance[kpc] 2.6 7.8 1.3 7.0 Diameter†[pc] 11 27 4.5 20 Luminosity ‡[erg s-1] 3.7x1033 2.3x1034 8.1x1032 2.2x1034 231 73 ·5 = 16 NSXS = Exposure [ks] G11.0+0.0 49 G25.5+0.0 50 G26.6-0.1 47 G28.6-0.1 71 Table 1. Exposure time for each source. (c) (b) (d) (a) AX J1841.0-0536 G28.6-0.1 G25.5+0.0 G11.0+0.0 G11.2-0.3 G26.6-0.1 Table 2. The best-fit parameters for a power-law model and an NEI plasma model†. Power-law model G NH (1022cm-2) Flux (ergs cm-2s-2)‡ Reduced c2 NEI model kT (keV) abundance log net (cm-3s) NH (1022cm-2) Flux (ergs cm-2s-1)‡ Reduced c2 G11.0+0.0 1.6 (1.4 – 1.9) 0.8 (0.5 – 1.1) 3.8x10⁻¹² 44.2/42 11.5 (7.3 – 21) 0.7 (0.1 – 1.8) 0.9 (< 4.2) 0.6 (0.4 – 1.1) 3.8x10⁻¹² 42.7/40 G25.5+0.0 1.8 (1.6 – 2.2) 2.4 (1.8 – 3.2) 2.0x10⁻¹² 55.4/48 7.1 (4.5 – 14) 0.4 (0.1 – 0.7) 3.2x10² (>58) 2.3 (1.8 – 3.0) 2.0x10⁻¹² 48.8/46 G26.6-0.1 1.3 (1.2 – 1.5) 0.4 (0.2 – 0.6) 3.5x10⁻¹² 73.2/55 14.5 (8.7 – 35) 0.5 (0.1 – 1.1) 5.1 (3.0 – 9.1) 0.9 (0.5 – 1.4) 3.4x10⁻¹² 63.5/53 G28.6-0.1 2.1 (1.7 – 2.4) 2.7 (2.0 – 3.5) 3.7x10⁻¹² 45.4/47 4.4 (3.3 – 6.2) 1.7 (0.5 – 3.4) 1.1 (0.4 – 1.9) 3.9 (3.0 – 4.9) 1.7x10⁻¹² 31.1/45 (a) (c) (b) (d) †: Errors refer to 90% confidence level. ‡: In the 0.7 – 10.0 keV band. †: Errors refer to 90% confidence level. ‡: In the 0.7 – 10.0 keV band. 5.2. How many SXSs in our Galaxy? 5.1. What are they? Table 4 is physical parameters of the sources. The spectra of these source are all hard. The thermal fittings give us quite high temperature ( > 3 keV)for ordinary SNRs. The low abundance of the spectra also suggest that it is hard to think the sources are thermal SNRs. The star forming regions emit relative hard thermal X-rays, however, these sources have no HI and IR counterparts and they are larger than ordinary star forming regions. Thus, we conclude that these hard and diffuse sources are all SNRs with non-thermal X-rays. SNRs emitting non-thermal X-rays are categorized into 2 types; one is SXSs, and the other is Crab-like SNRs with pulsars and pulsar-nebulae. They have large difference in the radio band; the SXSs are dim, whereas the Crab-like SNRs are strong emitter in the radio band. Since our sources have no strong radio counterpart, we concluded that they are all SXSs. G26.6-0.1 has so small photon index, then, it may have non-thermal bremsstrahlung origin like Gamma-Cygni (Uchiyama et al. 2002). We estimate the total number of SXS candidates which are escaped from the detection of previous radio surveys as follows. The ASCA Galactic plane survey covers |l|< 45º and |b| < 0.4º. In this region, 5 SXSs are found with the survey, our 4 sources and G347.3-0.5 (Koyama et al. 1997). On the other hand, there are 73 of 231 radio catalogued SNRs in this region (Green 2001). Assuming that the radio catalogued SNRs and the undiscovered SNRs have same distributions, we can estimate the total number of the undiscovered SXSs NSXS as follows; Table 4: The physical parameters of the sources. The distance of the furthest sample 7.8 kpc for G25.5+0.0 and smaller than the diameter of the Galaxy, then, NSXS must be larger than 16. Therefore, there are many SXSs still undiscovered still behind the Galactic plane. To confirm it, and to study SXSs quantitatively, it is important to search for them with deeper exposure and better spatial resolution in multi-wavelength. †: Assuming the density of the interstellar medium = 1 cm-3 ‡: In the 0.7 – 10.0 keV band Search for Synchrotron X-ray Dominated SNRs with the ASCA Galactic Plane Survey Aya Bamba1, Masaru Ueno1, Katsuji Koyama1, Shigeo Yamauchi2, Ken Ebisawa3 1: Kyoto University Japan, 2: Iwate University Japan, 3: INTEGRAL SDC Switzerland mailto:bamba@scphys.kyoto-u.ac.jp * This paper is submitted to ApJ. 1. Introduction Abstract 2. Observations Since the discovery of cosmic rays (Hess 1912), the most plausible site where particles are accelerated up to 1015.5eV is believed to be shock fronts of the SNRs (c.f. Reynolds 1998). Koyama et al. (1995) proved the hypotheses with the discovery of synchrotron X-rays from the shell of SN1006. However, nobody knows how many synchrotron X-ray dominated SNRs (SXSs) in our Galaxy, in other words, how ratio of cosmic rays are accelerated in SXSs. The most complete catalogue of Galactic SNRs are made in Radio band (Green 2001). However, the strong contamination of the Galactic ridge emission prevents from detecting the SNRs near the Galactic plane (Figure 1). Furthermore, SNRs in strong magnetic fields emits strong synchrotron radiation in radio band. On the other hand, SNRs in weak magnetic field accelerate cosmic rays without emit synchrotron radio emission, then they are escaped from the radio detection. They may be synchrotron X-rays from high energy electrons. Therefore, we searched for them from ASCA Galactic plane survey data. We report on the results of the SXS search and 4 SXS candidates found in our search. We search for Synchrotron X-ray dominant SNRs (SXSs) like SN1006 with the ASCA Galactic plane survey data and discovered four diffuse hard X-ray sources, G11.0+0.0, G25.5+0.0, G26.6-0.1, and G28.6-0.1. The X-ray spectra are featureless with no emission line, and are fitted with both the model of a thin thermal plasma in non-equilibrium ionization and a power-law function. The source distance are estimated to be 1– 8 kpc, using the best-fit NH under the assumption of 1H cm-3 for the mean density in the line of sight. The source sizes and luminosities are then 4.5–27pc and 0.8 – 22x1033 ergs s-1, respectively. Although the sizes are typical to SNRs in adiabatic phase, the X-ray luminosity, plasma temperature, and weak emission lines in the spectra are all unusual. Alternatively, the featureless power-law spectra lead to the scenario that the diffuse sources are SXSs or SNRs with non-thermal bremsstrahlung emission from MeV electrons like Gamma Cygni. This paper reports on the new SXS candidates and discusses on the origin of cosmic rays in our Galaxy. The ASCA Galactic survey covered |l|< 45°and |b|< 0.4°(Sugizaki 1999). We selected 4 SXS candidates from the survey data. They have hard and diffuse emission, then we designated them G11.0+0.0, G25.5+0.0, G26.6-0.1, and G28.6-0.1, respectively. To confirm whether they are SXSs or not, we made follow-up observations with ASCA. The data of survey and follow-up was summed up and were analyzed. After data screenings, the total exposure time for each source is shown in Table 1. Figure 1. The relation between the Galactic latitude b and the surface brightness S1GHz. We can see that the radio detection limit of the SNRs becomes higher as |b| becomes lower. 3. Analyses and Results Figure 2(a) – 2(d) are the images the detected X-ray emission in the 0.7 – 7.0 keV band. Except for the point sources (+ mark), we can see diffuse structure in all figures. From their position, we designated them as G11.0+0.0, G25.5+0.0, G26.6-0.1, and G28.6-0.1. Their background-subtracted spectra are shown in Figure 3(a) – 3(d). Since they are hard and have no emission line, we fitted them with a power-law function and NEI plasma model calculated by Borkowski et al. (2001). Both models were well fitted for all spectra as shown in Table 2. Detail of the analyses for the point and diffuse sources are shown in Bamba et al. (2001a, 2001b, 2002). We searched for the radio and gamma-ray counterparts, however, no counterpart was found except for G28.6-0.1 (Helfand et al. 1989). Figure 2. The images around the diffuse emission in the 0.7 – 10.0 keV band. The scale is logarithmic and the coordinates are in Galactic. Figure 3. The background-subtracted spectra of the diffuse sources. The solid lines are the best-fit power-law model (see Table 2.). 4. Chandra Follow-up Observation for G28.6-0.1 (b) (a) For G28.6-0.1, the follow-up observations with Chandra were performed in order to examine the correlation with radio emission. Figure 4 shows the true-color image of G28.6-0.1 overlaid to the radio contour. The radio source C and F have non-thermal spectra and are thought as an SNR. The X-ray emission is clumpy and fills the inner region of the non-thermal radio emission. Therefore, we confirmed that G28.6-0.1 emits truly diffuse X-ray emission. We discovered the peculiar source CXO J184357-035441 selendipitously. It has very peculiar structure like a “tad-pole” as shown in the close-up image Figure 6a. The spectrum shows strong He-like Si and S lines, then, we fitted it with an NEI model. The fitting was statistically accepted with the best-fit models and parameters are shown in Figure 6b and Table 3. The great spatial resolution of Chandra enables us to make pure spectrum of G28.6-0.1 by eliminating the contamination from the “tad-pole” nebula. The clean spectrum is well fitted with a power-law function of better statistics. The best-fit spectra are shown in Figure 5. The nature of the tad-pole nebula is still unknown, thus more deep observations are needed. More details are mentioned in Koyama et al. (2001) and Ueno et al. (2002). C Figure 6: (a): The close-up view of the “tad-pole” nebula in the energy band of 1.0 – 6.0 keV. The radio 20 cm is designated by solid-line contours. (b): The background-subtracted spectrum of the “tad-pole” nebula. The best-fit model is also shown. F Figure 5: The background-subtracted spectra of “tad-pole” nebula with the best-fit model. The squares and circles represents the two observations of this region. Table 3: The best-fit parameters for the spectral fittings of NEI plasma model† for the “tad-pole” nebula. Figure 4: The image around G28.6-0.1 with Chandra. The scale is logarithmic. White contours represent the VLA radio 20 cm map (Helfand et al. 1989). 5. Discussion 6. Conclusion • We discovered 4 hard and diffuse sources using ASCA Galactic plane survey. • The spectra of these sources are well describable with a power-law function of G=1.3 – 2.1. • For G28.6-0.1, we found the radio counterparts and follow-up observations with Chandra discovered the “tad-pole” nebula emitting thermal X-rays in G28.6-0.1. • They may be SXSs, although the broad band deep observations are needed to conclude that. • There must be about 16 or more SXSs in our Galaxy. References Bamba, A. et al. 2001a, PASJ, 53, L21 Bamba, A. et al. 2001a, PASJ, 53, 1179 Bamba, A. et al. 2002, submitted to ApJ Borkowski, K.J. et al. 2001, ApJ, 550, 334 Green, D.A., 2001, “http://www.mrao.cam.ac.uk/surveys/snrs/” Helfand, D.J. et al. 1989, ApJ, 341, 151 Hess, V.F. 1912, Phys. Zeits, 13, 1084 Koyama, K. et al. 1995, Nature, 378, 255 Koyama, K. et al. 1997, PASJ, 49, L7 Koyama, K. et al. 2001, proceedings of “New Visions of the X-ray Universe in the XMM-Newton and Chandra era” Reynolds, S.P., 1998, ApJ, 493, 375 Sugizaki, M. 1999, Ph.D. Thesis, University of Tokyo Uchiyama et al. 2002, ApJ, 571, 866 Ueno, M. et al. 2002, submitted to ApJ