
Understanding Tundra Biome: Characteristics, Flora, and Fauna
Discover the unique features of the tundra biome, characterized by low temperatures and distinct flora and fauna. This biome hosts a variety of plants such as grasses, shrubs, mosses, and lichens, alongside resilient animals like snow geese, musk oxen, wolves, and caribou. Learn the crucial concept of permafrost—permanently frozen soil—and how to visualize tundra climate data through a climate graph. This guide provides clear steps for drawing a climate graph, incorporating average temperatures and rainfall, essential for understanding this fascinating ecosystem.

Understanding Tundra Biome: Characteristics, Flora, and Fauna
E N D
Presentation Transcript
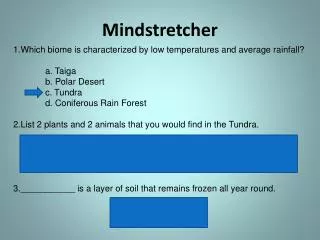
Mindstretcher 1.Which biome is characterized by low temperatures and average rainfall? a. Taiga b. Polar Desert c. Tundra d. Coniferous Rain Forest 2.List 2 plants and 2 animals that you would find in the Tundra. Plants: Grasses, shrubs, mosses, lichens Animals: Snow Geese, Musk Oxen, Wolves, Caribou, Mosquitoes 3.___________ is a layer of soil that remains frozen all year round. PERMAFROST
Step Two: Add months to x-axis J F M A M J J A S O N D
Step Three: Add temperature to left hand y-axis 20 15 Temperature in ⁰c 10 5 0 J F M A M J J A S O N D
Step Four: Add rainfall to the right y-axis 20 200 15 150 Rainfall in mm Temperature in ⁰c 10 100 5 50 0 0 J F M A M J J A S O N D
Now you’re ready to add the data! (You do need to look at your data before to work out what size your axis need to be!)
Step Five: Add your rainfall data 20 200 15 150 Rainfall in mm Temperature in ⁰c 10 100 5 50 Feb 90mm Jan 55mm 0 0 J F M A M J J A S O N D
Step Six: Add the temperature line 20 200 15 150 Rainfall in mm Temperature in ⁰c 10 100 5 50 Feb 14⁰c Jan 16⁰c 0 0 J F M A M J J A S O N D