Download
1 / 159
1.6k likes | 1.82k Vues
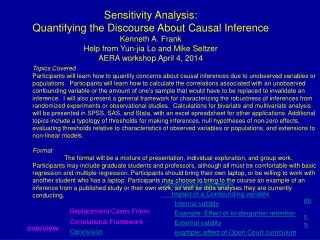
Introduction to Causal Inference Kenneth A. Frank CSTAT 2-4-2011. Overview. Alternative Causal Mechanisms and the Counterfactual Approximations to the Counterfactual How Regression works: Explained Variance in Regression Concern over Missing Confound (Internal Validity)

E N D
Introduction to Causal Inference Kenneth A. Frank CSTAT 2-4-2011
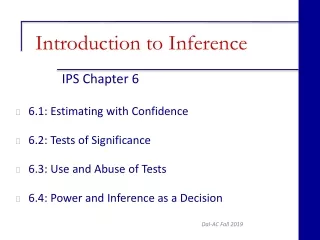
Overview • Alternative Causal Mechanisms and the Counterfactual • Approximations to the Counterfactual • How Regression works: Explained Variance in Regression • Concern over Missing Confound (Internal Validity) • Consider Alternate Sample (External Validity) • Defining Absorption • Analyzing Pre/post-test designs ANCOVA: Analysis of Cova... • Schools as Fixed or Random • Statistical power in multilevels • Differential Treatment Effects and Heckman’s Rationality • References on Causal Inference
My Take • Sociological • Motivated by studies of social context • People select themselves into contexts • Cannot randomize • Each context is different (effects across contexts?) • Regression based • Control for confounds • Explore interactions • Sensitivity/robustness • What would it take to invalidate an inference?
Methods Covered • Counterfactual (2 potential outcomes) • Statistical control via regression/general linear model • Random and fixed effects • Robustness of inference • for impact of a confounding variable (internal validity) • for representativeness of sample (external validity) • Robustness indices a form of sensitivity analysis • Absorption • Randomization • Instrumental variables • Pre-test • Differential treatment effects • Treatment effect for treated/for control • Propensity scores • Attention to assignment mechanism • Logistic regression • Using propensity scores in analysis • Weighting • Control • Strata • matching
Example: The effect of National Board Certification on the help a teacher provides others (Frank et al) What is National Board Certification? The National Board (a private organization) offers a certification process for primary and secondary teachers. The process takes approximately 1 year and involves considerable reflection and documentation of practice. Emphasis on progressive approach to teaching and engagement in professional leadership. The fifth core proposition of the NBPTS states that accomplished teaching reaches outside of the individual classroom and involves collaboration with other teachers, parents, administrators, and others (National Board for Professional Teaching Standards, 1989) Descriptive Q: Do National Board certified teachers (NBCTs) provide more help to others in their schools than non-NBCTs? A: Yes, the average NBCT is nominated by about 1.6 others as providing help with instruction, in contrast to about .95 for a non-NBCT. Causal Inference Q: Does National Board certification affect the amount of help a teacher provides? Frank, K.A., Gary Sykes, Dorothea Anagnostopoulos, Marisa Cannata, Linda Chard, Ann Krause, Raven McCrory. Extended Influence: National Board Certified Teachers as Help Providers. Submitted to Education, Evaluation, and Policy Analysis
Policy Implications • Board has emphasized helpfulness as one of its goals • Other Practices of BCT’s may disseminate throughout school • Key goal of organizational literature has been to cultivate more “social capital” and sense of community, where teachers help each other more better student outcomes. • Amount of help teachers receive affects implementation of innovations (Frank, Zhao and Borman 2004; Zhao and Frank 2003) http://www.msu.edu/~kenfrank/research.htm#social Incentives for more teachers within existing BCT oriented schools to become BCT’s • Incentives for schools and districts with few or no BCTs to engage BCT
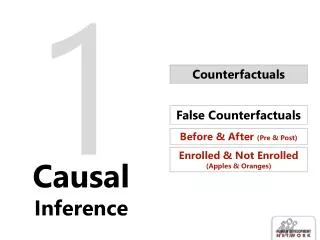
Correlation Does Not Equal Causation • Estimated effect could be attributed to unmeasured covariate alternative causal mechanism • Example Y=amount of help a teacher provides to others s= whether or not a teacher became National Board Certified cv=confounding variable (e.g., inclination to be helpful) representing alternative causal mechanism
Alternative Causal Mechanisms and the Counterfactual • I have a headache • I take an aspirin (treatment) • My headache goes away (outcome) Q) Is it because I took the aspirin? • We’ll never know – it is counterfactual – for the individual This is the Fundamental Problem of Causal Inference
Treatment Effect and Missing data for the Counterfactual Assignment Potential Outcome
Counterfactual and Philosophers: Hume • spatial/temporal contiguity: • Cause and measurement of effect apply to single unit • Temporal succession • Effect assessed after treatment is applied • Constant conjunction • If effect is constant • Missing: effect of one cause is relative to effects of others
Mill • Liked the experimental paradigm • Concommitant variation: • Correlational smoke causational fire ( I agree, more later) • Method of Difference: Yit – Yic • Method of Residues Yab – Ya • Method of Agreement Yit – Yic=0 implies null effect, • compare observed effect against null effect • Limitation: anything can be a cause
Suppes • Prima facia cause • Correlation • Genuine Cause • No confounding vaiables Liked the experimental paradigm • Limitation: must explain full cause of effect, rather than small effect of particular cause
Lewis • Named the counterfactual • If A were the case, C would be the case” is true in the actual world if and only if (i) there are no possible A-worlds; or (ii) some A-world where C holds is closer to the actual world than is any A-world where C does not hold. http://plato.stanford.edu/entries/causation-counterfactual/
Basic Model for the Counterfactual 9=2+4+3 5=2+3 =[2+4+3]-[2+3]=[(2-2)+(4-0)+(3-3)=4 =2+(1 or 0)x4+3 9=2+(1)x4+3 5=2+(0)x4+3 =[2+4+3]-[2+3]=[(2-2)+(4-0)+(3-3)=4
Treatment Effect and Missing data for the Counterfactual Assignment Potential Outcome
Reflection • What part if most confusing to you? • Why? • More than one interpretation? • Talk with one other, share • Find new partner and problems and solutions
Approximations to the Counterfactual Compare repetitions within person (observe teachers before and after certification) Randomly assign people to become certified or not (Fisher/Rosenbaum) Randomization (with large enough n) insures that there will be no baseline differences between those assigned to treatment and those assigned to control Regression (assuming all relevant confounds have been measured) Each attempts to approximate the counterfactual by insuring no relationship between confound and assignment to treatment condition (rx cv=0 rx cvx x rx cv=0)
Logistics Getting people to agree Independence People within social contexts (e.g., schools) are dependent randomize at level of context (the school) $$$$$$$ Ethics Assigning adolescents to friendship groups?! Timing: the longer the treatment intervention, the more likely to violate assumption that control group represents forecast for treatment group Exposure to confounding with small n Randomization often not possible, especially for social contexts
Was causal inference impossible prior to randomized experiments (circa 1930)? Make maximum use of data Approximate counterfactual Statistical control propensity score matching – match those who received treatment with similar others but who received control (like “twins”). Rubin’s (1974) response
SPSS Syntax for reading in toy counterfactual data DATA LIST FREE / y confound s . Begin DATA . 9 6 1 10 7 1 11 8 1 5 3 0 6 4 0 7 5 0 End DATA .
Counterfactual Predicted Values from Regression: Effect isn’t 4, it’s 1!
Regression Without Control: wrong answer: Estimate of 4 REGRESSION /MISSING LISTWISE /STATISTICS COEFF OUTS R ANOVA /CRITERIA=PIN(.05) POUT(.10) /NOORIGIN /DEPENDENT y /METHOD=ENTER s .
Regression with Control: Right answer, Estimate of 1 REGRESSION /MISSING LISTWISE /STATISTICS COEFF OUTS R ANOVA /CRITERIA=PIN(.05) POUT(.10) /NOORIGIN /DEPENDENT y /METHOD=ENTER s confound .
Counterfactual Predicted Values from Regression: Effect isn’t 4, it’s 1!
Keys to Statistical Control • Need to know and measure relevant covariates (identically independently distributed errors) • Omitted confound dependencies among units that have similar values on the confound (e.g., teachers who are similarly inclined to help) • Assumes optimal control for covariate is linear function of X’s • Assumes constant treatment effect
How Regression works: Explained Variance in Regression Circles represent variances Y X1 X2 X1 and X2 explain different parts of Y X1and X2are independent (uncorrelated)
But usually there is multicollinearity (or the need for statistical control) ‘competition’ between the variables (in explaining Y)! Y X1 X2 The degree of competition depends on the amount of Correlation (overlap) between the ‘independent’ (!) variables
Y e a b c X1 X2
Example: The effect of National Board Certification on the help a teacher provides others (Frank et al) Descriptive Q: Do National Board certified teachers (NBCTs) provide more help to others in their schools than non-NBCTs? A: Yes, the average NBCT is nominated by about 1.6 others as providing help with instruction, in contrast to about .95 for a non-NBCT. Causal Inference Q: Does National Board certification affect the amount of help a teacher provides?
Data 47 schools (in 2 states) 1583 teachers Case studies in 4 schools Surveys: background attitudes towards leadership and bct sociometric: teachers were asked to list others who helped with instruction
Syntax for Descriptives GET FILE='C:\Documents and Settings\kenfrank\My Documents\MyFiles\sykes\workshop.sav'. DESCRIPTIVES VARIABLES=bct leave female glevel owned yrstch nograde attracth expanseh bcttreat leader leadna white /STATISTICS=MEAN STDDEV .
Table 1:Measures andDescriptive statistics (n=1363) (n is approximately 1208)
Descriptives Separately for BCT and non-BCT GET FILE='C:\Documents and Settings\kenfrank\My Documents\MyFiles\sykes\workshop.sav'. SORT CASES BY bct . SPLIT FILE LAYERED BY bct . DESCRIPTIVES VARIABLES=leave female glevel owned yrstch nograde attracth expanseh white bcttreat leader leadna nbct /STATISTICS=MEAN STDDEV . Try it, what do you get?
Recall regression model with statistical control for a confound
Unpartialled (zero-order, or total) variation between help provided (y) and board certification (x) is .1762=.031 Partialled and unpartialled (zero order) correlations Variation between help provided (y) and board certification (x), partialled for enhancement of teaching through leadership is .1672=.028 Difference unpartialed and partialed is variance between board certification (x) and help provided (y) also accounted for by enhancement of teaching through leadership (confound): .031-.028=.003
How Regression Works: Overlapping Variances Help provided Help provided Board Certification Board Certification Enhancement Through leadership Variance between help provided and board certification =.1762=.031 Variance between help provided and board certification, Partialling for enhancement through leadership, =.1672 =.028
How Regression Works: Partial and Semi-Partial correlation Partial Correlation: correlation between s and y, where s and y have been controlled for the confounding variable Semi-Partial Correlation: correlation between s and y, where s has been controlled for the confounding variable
Regression and Correlation Coefficient T ratio for regression coefficient and correlation are identical
Regression of Help Provided on Board Certification Controlling for Enhancement of Teaching through Leadership Model: y=β0 +β1 c Model: s=β0 +β1 c Controlling for enhancement of teaching through leadership
How Regression Works: Impact of Enhancement of Teaching Through Leadership on Correlation Between Board Certification and Help Provided rsy=.176 rsy|cv=.167
Calculating Impacts:Correlations Between BCT, Amount of Help Provided, and Covariates
Impacts of Covariates on Correlation between BCT and Help Provided Component Correlations
Reflection • What part if most confusing to you? • Why? • More than one interpretation? • Talk with one other, share • Find new partner and problems and solutions
ExerciseHow Regression Works:Exercise • Calculate the correlation between board certification and help provided • Unpartialed • Partialed (for something other than leadership) • (see basic calculations, sheet 1). https://www.msu.edu/~kenfrank/research.htm#causal • Do same for example in a data set you have
Exercise: Find Impacts of measured Covariates on Correlation between BCT and Help ProvidedUse data file “Board Certified Teachers” GET FILE='C:\Documents and Settings\kenfrank\My Documents\MyFiles\COURSES\causal '+ 'inference\groningen\data\spass_data\workshop.sav'. DATASET NAME DataSet6 WINDOW=FRONT. CORRELATIONS /VARIABLES=attracth bct expanseh white female leave glevel nograde owned yrstch leader nbct nbctsq bcttreat leadna /PRINT=TWOTAIL NOSIG /STATISTICS DESCRIPTIVES /matrix=out(forimp) /MISSING=PAIRWISE . GET FILE= ' forimp'. AUTORECODE VARIABLES=ROWTYPE_ varname_ /INTO t n /PRINT. FILTER OFF. USE ALL. SELECT IF(t = 1 and n>=4). EXECUTE . COMPUTE impact = attracth * bct . EXECUTE . SORT CASES BY impact (D) . SAVE OUTFILE='impact' /keep rowtype_ varname_ attracth bct impact /COMPRESSED.
Reminder: Motivation: If you don’t argue scientifically, those who you disagree with will, and your views will not be heard