Download

1 / 23
230 likes | 430 Vues
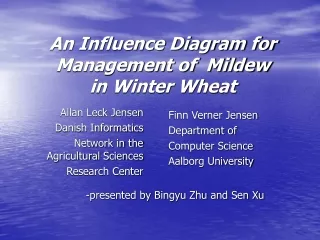
Allan Leck Jensen Danish Informatics Network in the Agricultural Sciences Research Center. Finn Verner Jensen Department of Computer Science Aalborg University. An Influence Diagram for Management of Mildew in Winter Wheat. -presented by Bingyu Zhu and Sen Xu. Abstract.

E N D
Allan Leck Jensen Danish Informatics Network in the Agricultural Sciences Research Center Finn Verner Jensen Department of Computer Science Aalborg University An Influence Diagram for Management of Mildew in Winter Wheat -presented by Bingyu Zhu and Sen Xu
Abstract • A prototype of a decision support system for management of the fungal disease powdery mildew in winter wheat • An influence diagram which is used to determine the optimal time and dose of mildew treatments • Practical and theoretical problems during the construction of the influence diagram, and also the experience with the prototype
Background • In Denmark, environmental impacts of agricultural production must be reduced. • Findings of pesticides and nitrogen residues in drinking water have induced the government to take actions for a significant reduction of the consumption of fertilizers and pesticides.
Dilemma of farmers • Agricultural input factors: fertilizers and pesticides—very expensive • Reductions in these input factors can cause inadequate effects and hence economical losses • Farmers: apply excessive amounts of input factors to avoid inadequate effects of input factors.
How to solve … • Reduce the consumption of input factors and save money if they can get the recommendations that when it is safe to reduce the doses. • These recommendations could come from decision support systems • Insurance farming Precision farming
Decision Support System • MIDAS – Mildew Influence Diagram for Advice of Sprayings. • Influence diagram: Case-specific recommendations of timing and dosage of mildew treatments. The Ph.D. thesis can be downloaded from http://www.sp.dk/~alj/
The Disease-Powdery Mildew • Weather condition—temperature, humidity and wind • Under favorable conditions • Spread rapidly • Under unfavorable conditions • Not spread, the present disease may disappear with time due to the emergence of new, uninfected leaves and the death of old, infected leaves
MIDAS • Based on the field observations and the expectations to the future • Determine the optimal treatment decision for the current disease problem • Assumption: all future decisions will be made optimally according to the available information at the time
Decision Optimization • Affected by uncertainty of • Stochasticity • Weather and disease infections with elements of unpredictability • Inaccurate observations • Field recordings of disease level are difficult and error prone • Incomplete knowledge • Interpretations of relations in domain involves uncertainty
Dynamic Influence Diagram • A sequence of time steps. • Each time step • Information variables • A single treatment decision variable • Chance variables • Time is an important parameter
Thermal Time Scale • Three influentials • Chronological time • Temperature • Crop development stage • Thermal time scale • Definition: The expected temperature sum remaining to crop maturity • Divided into thermal time periods, each corresponding to a time step of the decision model. • Length of a time step is called a thermal week. • Farmers give their estimates of the number of weeks to crop maturity
GDM module Case-specific time step modules Decision model Tn Ti T2 T1 T2 T1 Tn The Initial Influence Diagram Time Field
Dynamic Programming • First, the final decision is considered • For each information scenario at that time, the decision alternative with optimal expected utility is determined. • The preceding decisions are considered in reverse order, and each of them is optimized under assumption of optimal decision making in the future.
Computation Complexity Problem • The set of information scenarios at the time of a decision consists of all configurations of observed variables which are d-connected to a utility node influenced by the decision. • DiseaseLevel in initial GDM the current state of the disease depends on not only the current value of DiseaseObser, but also all the previous, together with all previous treatment decisions.
Information Blocking Condition • The local information of the system overwrites all previous information. • P(Y | Ik, Dk, X) =P(Y | Ik, Dk) for X є U Ti (i=1,…,k-1), Y є U Ti (i=k+1,…,n). • P(Y | Tk, X) =P(Y | Tk)
Change the structure DiseaseObserv_1 DiseaseObserv_1 DiseaseLevelB_1 DiseaseLevelA_1 DiseaseLevelB_1 DiseaseLevelA_1 Figure3: Left: The initial causal structure of the relationships between the DiseaseObserv and the DiseaseLevel nodes. Right: The modified structure to achieve a blocking of the past by the observed nodes(DiseaseObserv).
Experience--Quantitative • Single model clique size 27388 probabilities, 83196 for each additional time step. • 1.6 Million for a model with 20 time steps, 14.8M to store. • Performance on SUN Assemblage 1 sec Compilation 100 secs Loading 25 secs Propagation 25 secs
Experience--Qualitative • Evaluation of the predictions of DiseaseLevel • True and Approximate Structures • True structure are good. • Approximate Structure less satisfactory underestimate high disease levels and overestimate low disease levels. • Predicted probability distributions are too narrow. • DiseaseObserv was intended to be a simple measure for DiseaseLevel.
Future Work--Improvement • Several Different Prior Distribution for P(DLB) in order to fit actual situation. • Additional information node introduced, in order to improve the calibration of DeseaseLevel. • Relaxation of the information blocking condition. • Approximative for decision, true for reasoning. • Other problems.