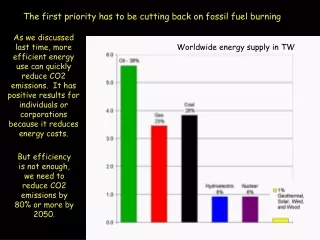
Worldwide energy stats
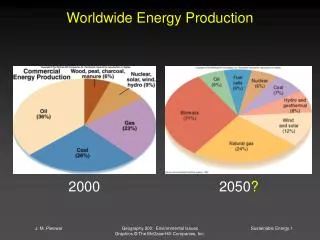
Worldwide energy stats. Total energy consumption:15 TW (10 12 ) in 2004 (86.5 % from fossil fuels) This corresponds to 5 ·10 20 J/yr Worldwide reserves of fossil fuels -4000·10 20 J (800 yrs) 2.5·10 24 J of uranium reserves

Worldwide energy stats
E N D
Presentation Transcript
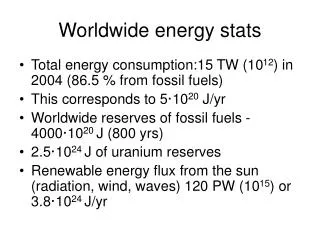
Worldwide energy stats • Total energy consumption:15 TW (1012) in 2004 (86.5 % from fossil fuels) • This corresponds to 5·1020 J/yr • Worldwide reserves of fossil fuels -4000·1020J (800 yrs) • 2.5·1024J of uranium reserves • Renewable energy flux from the sun (radiation, wind, waves) 120 PW (1015) or 3.8·1024J/yr
EERE funded by DOE $2.3 B • Biofuels ($235 M) • Batteries ($200 M) • Fuel Cells ($68 M) • Hydrogen (cut from 2010 budget, considered too long term) • Solar cells ($320 M) • Wind ($75 M) • Water/Geothermal ($30 M / $50 M) • Green Buildings ($237 M) • Financing for states, industry and consumers to encourage adoption ($350 M) • Nuclear ($845 M /$191 for Gen IV)) Office of Nuclear energy • Fusion ($421 M) Office of Science ($4.9 B)
Potential for solar • A land mass of about 100x100 miles in the Southwest U.S.-less than 0.5% of the U.S. mainland land mass, or about 25% of the area currently used for the nation's highway/roadway system-could provide as much electricity as presently consumed in the United States. • Truly renewable, with a net positive energy • Can be converted into electricity
Solar cells • For use at site of power use • Integration of solar energy into the electrical grid • Semi-conductor • Absorb photon • Excite electron into conduction band • Mobile electron holes • directional flow of electrons • An array of solar cells produce a usable quantity of direct current (DC) • Store the charge that is produced
Types of solar cells • Wafer- based crystaline silicon • Mono vs. poly (less efficient, but cheaper) • Thin film Si – more flexible, lighter • Cadmium telluride (Cd/Te) solar cell – easier to deposit/large scale production • Cu/In/Ga • Organic polymer cells (low cost, large scale production and flexibility, poor efficiency) • Sensitized Solar cells (Grätzel cells); semi-conductor formed between photo-sensitized anode and an electrolyte
Performance • Efficiency (5-20 %) • Manufacturing cost (materials and methods) • Net Energy Analysis (Break even in 1-7 yrs depending on solar cell) • Trade-off between efficiency and cost
Additional factors • Solar concentrators (use a large area of lenses or mirrors to focus sunlight on a small area of photovoltaic cells) • 400 suns • 300 times reduction of materials • Inverters and grid integration • One way to two way grids that communicate
Table 2.1–3 Technical Barriers in Photovoltaics Photovoltaic Technical Barriers Modules A. Material Utilization & Cost B. Design & Packaging C. Manufacturing Processes D. Efficiency Inverters & Other BOS E. Inverter Reliability & Grid Integration F. Energy Management Systems G. BOS Cost & Installation Efficiency Systems Engineering & Integration H. Systems Engineering I. Modularity & Standardization J. Building-integrated products
2015 Goal • PV-produced electricity and domestic installed PV generation capacity of 5-10 GW • 1000 GW/yr of electricity in US • Much more long term
Concentrating Solar Power (CSP) technologies • Large scale electricity plants in the Southwest US • CSP plants produce power by first converting the sun’s energy into heat, next into mechanical power, and lastly, into electricity in a conventional generator. • Thermal storage (molten salt) or hybrid natural gas system
Nuclear Energy • How does a nuclear reactor work? • Is it a major energy source worldwide? • Problems • Waste Disposal • Accidents • Future • Research • Generation IV
Nuclear Energy Plant • Nuclear Fission • 235U + n → 236U → 92Kr + 141Ba + g + 3n • Chain Reaction • Controlled by control (graphite) rods and water coolant • Heat from reactor is cooled by circulating pressurized water • Heat exchange with secondary water loop produces steam • Steam turns turbine generator to produce electricity
Present Nuclear Energy • 100 plant produce about 20 % of the electricity in US • 431 plants worldwide in 31 countries produce about 17 % of the world’s electricity • Environmental Impact • No Greenhouse gases • Completely contained in normal operation • Spent fuel issue
Waste Disposal • Waste kept at plant, but running out of room. • Site chosen in Nevada for nuclear waste. • Research on safe transportation • Nuclear proliferation; fuel is very dilute and not easily converted to weapons grade • Stored in very heavy casings (difficult to steal)
Accidents • Nuclear Meltdown • Chernobyl • Three Mile Island • Environmentalist watch dogs note other near misses in recent years
Chernobyl (1986) • A planned test gone horribly wrong • The test • See if turbine generator could power the water pumps that cool the reactor in the event of a loss of power • Crew shut off power too rapidly, producing a Xe isotopes that poisons the reactor • In response the rods were lifted to stimulate reaction • The lower cooling rate of the pumps during the experiment led to steam buildup that increase reactor power • Temperature increased so rapidly, that rod insertion could not be performed in time to stop meltdown • Roof blew off, oxygen rushed in a caused fire that spread radioactive material over a large area
Blame Management communication A bizarre series of operator mistakes Plant design, poor or no containment vessels Large positive void coefficient (steam bubbles in coolant) Poor graphite control rod design Poorly trained operators Shut off safety systems Helicopter drops Coverup
Consequences • Deaths of plant and workers • Medical problems (short and large term) • Thyroid cancer • Contaminated soil as far as Great Britain • Billions of $
Three Mile Island • Partial meltdown • No radiation escaped • Caused fear of nuclear power and cost $ in terms of clean up • Operator error and lack of safety backups in design • In some ways the accident showed how the kind of catastrophic disaster at Chernobyl is avoidable
types • Generation I – retired; one of a kinds • In operation Gen II and Gen III • Gen II was a large design changes • Gen III and Gen II, upgraded with many safety features along the way • Gen III plus (passive safety systems) • Gen IV, 30 yrs away
Gen IV • Very High Temperature Reactor • Advance Nuclear Safety; • Address Nuclear Nonproliferation and Physical Protection Issues; • Are Competitively Priced • Minimize Waste and Optimize Natural Resource Utilization • Compatible with Hydrogen Generation
Gen IV Roadmap - 2002 • Solicited design models • Chose six design models to base future research • Out of these six, the DOE has relatively recently selected two for further investment • Very-High Temperature Reactor (VHTR) • Sodium-Cooled Fast Reactors (SFR)
Very-High Temperature Reactor • Reach temperatures > 1000 C • Drive water splitting for hydrogen production – 2 M m3 • 50% efficiency for producing electricity • Heat and power generation • Fuel recycling/reprocessing • Fuel coating requirements, absorbers, ceramic rods, vessel materials, passive heat removal systems
Actinide management • To support effective actinide management a fast reactor must have a compact core with a minimum of materials which absorb or moderate fast neutrons. This places a significant heat transfer requirement on the coolant.
Sodium-Cooled Fast Reactors • Old technology • Management of waste • Low system pressure, high thermal conductivity, large safety margins. • Burns almost all of the energy in uranium, as opposed to 1% in today’s plants • Smaller core with higher power density, lower enrichment, and lower heavy metal inventory. • Primary system operates at just above atmospheric pressure • Secondary sodium circulation that heats the water (if it leaks, no radiation release) • Demonstrated capability for passive shutdown and decay heat removal.
Wind Energy • Electricity • In 2005, 18 GW produced in US, enough to supply 1.6 million households • By 2008, 121 GW worldwide (1.5 %) • It has doubled in the last 3.5 years • Largest farm in US in Texas • 421 turbines, 230,000 homes • Cape Cod/Long Island plan • Capacity in US • 170 turbines, 25 sq miles, 500,000 homes (2007) • 28,635 MW, 1.5 M homes (as of April 30, 2009).
20 % by 2030 initiative • 300 GW goal • The wind industry is on track to grow to a size capable of installing 16,000 MW/year
Politics and economics • Not in my backyard • The cost of the project grows (the big dig phenomenon
Cape cod • 130 wind turbines • 420 megawatts • 3/4 of the Cape and Islands electricity needs • The late Senator Kennedy and the candidates for his seat.
Long Island Wind Farm • Each wind turbine will generate 3.6 megawatts. • The project will consist of 40 turbines, producing a total of 140 megawatts. • The facility will generate enough energy to power approximately 44,000 homes. • Each turbine rotor has three blades approximately 182 ft. long. • The turbines shut down at wind speeds beyond 56 mph. • Project called off in 2007 (voted down) • But new project surfacing in 2008/09 700 (MWs)
Rhode Island • State officials picked Deepwater Wind to build a $1.5-billion, 385-megawatt wind farm in federal waters off Block Island. The 100-turbine project could provide 1.3 terawatt-hours (TW·h) of electricity per year - 15 percent of all electricity used in the state.
2005 Report from the National Renewable Energy Laboratory • Estimates offshore US wind potential • Offshore has several advantages over onshore • Land with greatest wind potentials are far from populated centers • Less of an eye sore • Stronger, more dependable winds • Use of larger, more economical turbines
US Offshore Wind Resource Exclusions Inside 5nm –100% exclusion 67% -5 to 20nm resource exclusion to account for avian, marine mammal, view shed, restricted habitats, shipping routes & other habitats. 33% exclusion–20 to 50 nm
Deep water • In June 2009, Secretary of the Interior Ken Salazar issued five exploratory leases for wind power production on the Outer Continental Shelf offshore from New Jersey and Delaware. The leases authorize data gathering activities, allowing for the construction of meteorological towers on the Outer Continental Shelf from six to 18 miles offshore.
US Potential • Over 1 TW, which is about equal to the total capacity for electricity generation in US. • Requires research into the construction of off(off)shore turbines • Research into potential environmental impacts • Research into best sites (wind/wave action, whale migration, ect.) • 10-15 yrs from commercial deepwater technology
Hydro • 7 % of US electricity • 70 % of renewable electricity • Research: • improving environmental impact of damming • Expand use • Hydrokinetic (wave, tidal, current, and ocean thermal energy)