Agent-Based Modeling
Agent-Based Modeling. PSC 120 Jeff Schank. Agent-Based Modeling. What Phenomena are Agent-Based Models Good for? What is Agent-Based Modeling (ABM)? What are the uses of ABM? Model Assumptions Analyzing Models Comparing Models to Data. What are they good for?. Complex systems

Agent-Based Modeling
E N D
Presentation Transcript
Agent-Based Modeling PSC 120 Jeff Schank
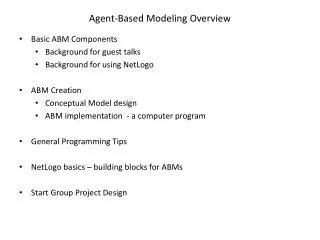
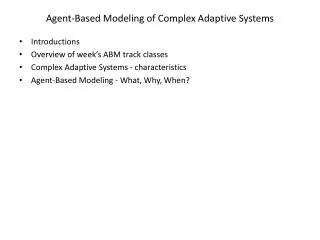
Agent-Based Modeling • What Phenomena are Agent-Based Models Good for? • What is Agent-Based Modeling (ABM)? • What are the uses of ABM? • Model Assumptions • Analyzing Models • Comparing Models to Data
What are they good for? • Complex systems • Emergent phenomena • When we understand the parts better than the whole • When we seek mechanistic explanations • When we are faced with multiple levels of organization
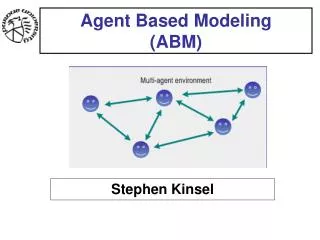
What is ABM? • ABM is a general Style of modeling that focuses on individuals • Agents can represent people, animals, or entities at different levels of organization • The modeling of agents typically require the specification of rules for agent behavior and interactions • ABM is a style of modeling that has features of both experimental and mathematical styles of thinking • When designing an ABM it is often useful to think like an experimentalist • What behaviors and properties do/should agents have? • How should the environment be designed and controlled? • How should experiments be designed? • Most ABMs have probabilistic elements, so each simulation experiment may differ considerably even for the same parameter values • Thus, a large number of simulated experiments are often required to analyze an ABM for a given set of parameters • From a mathematical style of thinking, the emphasis should be on investigating the entire parameter space or regions of interest in more complex models
What are the uses of ABM? • To model complex systems in which individual behavior and properties are better understood than the behavior and properties of the system • Molecular and cellular biology • Ecology • Anthropology and other social sciences • Animal behavior • Exploratory modeling • Artificial life • Evolutionary game theory • Investigating the robustness of analytical results • Evolutionary game theory • Ecology • Evolutionary Biology
Analysis of Models • Parameter sweeps • Systematically vary one or move parameters of a model • The limitations are on the number of parameters • If there are two parameters and you want to look at 5 values for each parameter, then you must conduct 5 × 5 = 25 sets of simulations • As you can see, the number of sets of simulations to be conducted increases exponentially with the number of parameters to be swept • Another approach is to use genetic algorithms to evolve models that either fit some set of goals or data of interest • I’ll discuss an example of both approaches
Ovarian-Cycle Synchrony • Does ovarian-cycle synchrony exist in mammals? • The problem of cycle variability • Ovarian cycles and female mate choice • The cost of synchrony
Synchrony? • Studies have reported synchrony in • Women • Norway rats • Golden hamsters • Golden lion tamarins • Chimpanzees • All are fundamentally flawed and more recent studies have found no effects
The Cost of Synchrony • There are two types of fitness costs for synchronized females • Male quality • Mating opportunities • To explore these costs, I built an ABM, based on J. B. Calhoun’s study: The Ecology and Sociology of The Norway Rat
Calhoun’s Rats ABM • Aims and Design • Ecologically realistic • Based on data • 5 to 10 reproductive females at a given time • 61 adult males (7 high, 12 medium, 42 low) • Movement is determined by “collapsing” preferences into a local probability space surrounding a model rat
Conclusions • Ovarian cycles may have evolved to facilitate female mate choice • Synchrony has fitness costs • Cycle variability may have fitness benefits in promiscuous mating systems
The Development of Locomotion • How do animals do what they do? • How do we answer this question? • Start simple and work to the complex • If we want to understand how something works in space and time, it is often a good idea to build it or something like it. • We cannot just build animals at different stages of development, but we can build models of them, which may help us understand them better (i.e., simulation, robotic)
Rat Pups • Born with very limited sensorimotor capabilities • Blind and deaf till days 13 to 15 • Legs cannot lift the body off the ground till after day 10 • However, they can aggregate in huddles and thermoregulate
Behavior in a Temperature Controlled Arena: A Simple Paradigm
Metrics • Basic metric: tip of nosebase of tail location • Derived metrics • Activity • Object Contact • Speed • Aggregation • Conditional Probabilities
7 and 10 Day Old Individual Locomotion: Examples Day 7 Day 10
7 and 10 Day Old Individual & Group Locomotion Individual Group
Column Row P P W E E E E E An Agent-Based Model
Genetic Algorithms • Arrange the parameters of the into a “chromosome” • Create a population of models • Perform mutation and crossover on pairs of models • Run a number of simulations and choose the parameters that best fit the data
Locomotion Kinematic Results Day 7 Day 10 Individual Group
7 and 10 Day Subgroup Formation Day 7 Day 10
7 and 10 Day Old Individual Locomotion: Examples Day 7 Day 10
Model Examples Day 7 Day 10