Download
1 / 25
250 likes | 423 Vues
Fundamentals of Research Methods for Development Studies LECTURE 4 (2011-2012) Quantitative data collection CARLOS OYA. The quantitative research process step-by-step. Research Questions / hypotheses. Theory / Topic. Research design. Indicators / measures of concepts. Sampling

E N D
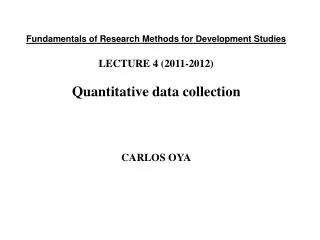
Fundamentals of Research Methods for Development Studies LECTURE 4 (2011-2012) Quantitative data collection CARLOS OYA
The quantitative research process step-by-step Research Questions / hypotheses Theory / Topic Research design Indicators / measures of concepts Sampling selection of respondents Select research site Questionnaire design and administration collect data Data analysis Data processing & cleaning Dissemination Findings / interpretations / conclusions
Considerations on operationalisation • A concept can be operationalised with multiple indicators, and indicators can rely on a range of measures • Remember issues of reliability and validity in the choice of indicators are results representative? consistent over contexts/samples do we work with a representative sample? Representative of what?
Theoretical concept Social class Economic status Occupational status Educational status Identification of dimensions Selection of indicators Income Occupation Education Identification of empirical referents Amount of money Type of job Years of schooling Quantification of concept Empirical concept Source: Sarantakos 2005, p. 140
Operationalising a ‘vote’ asking someone how they did vote in a specific election (fact); asking someone how they plan to vote in a coming election (plan/attitude); asking someone which party or person they support in general; discussing in general terms the political positions the respondent takes, and classifying these into support for one or another electoral party (analyst decides); asking for a complete report of all the votes the person has cast, in order to assess the usual voting behaviour and any exceptions.
Quantitative data collection and sampling • Objective of quant research: inferential statements about the population – more emphasis on ‘average’ and ‘statistically representative’ • Sampling (and sampling-related) vs. non-sampling errors (data collection and processing) • Methods: face to face (paper or PDA), email, web-based, mail, telephone.
Classic survey administration Bryman 2008, p.167
Sampling terminology • Sample design • Sampling unit / element • Population • Sample size • Sampling fraction • Sampling frame • Sample statistics • Population parameters • Saturation point
General sample principles • There may be a difference between sampling statistics and population parameters which depends on the sample (sampling error) • The larger the sample size, the more likely sample statistics are to be more accurate / precise • The greater the heterogeneity in the variable under study, the greater the likely gaps between sample statistics and population parameters
Sample size How large should my sample be? • absolute size matters more than relative size so a sample of 1,000 may be good for very different populations • the larger the sample, the more precise and representative it is likely to be and smaller the confidence intervals • as sample size increases, sampling error decreases • However, from a certain point, decreasinggains in precision cost matters (e.g. sample of 3,000 hh in The Gambia for 1.3m population vs 8,000 in Mozambique for over 17m; a sample of 10,000 or less may be valid for both UK and USA) • Sample size also determined/influenced by heterogeneity of population and what type of analysis
Probability (random) sampling Simple Random Sampling Systematic Random Sampling Stratified Random Sampling (with strata proportionate or disproportionate to size) Cluster random sampling (for logistical ease) Non-probability sampling Accidental / convenience Quota Purposive Snowballing Self-selecting Sampling methods
Stratified sampling advantage Bryman 2008, p. 174
Examples of cluster sampling National multi-purpose household surveys do not use sample from frames of households or individuals but administrative units (enumeration areas, similar to neighbourhoods or clusters of villages): Geographical strata applied Random choice of Eas (clusters) Random choice of hhs within each EA (a fixed number per cluster) A researcher is investigating health care provision in a country and uses doctors and nurses as units of observation Hard to get sample frame of doctors or nurses so a sample frame is obtained for health units (posts, hospitals) or a sample frame for administrative units is used for initial choice and then choice of health posts within admin units A random sample of health units is taken, followed by a random sample of doctors and nurses within the selected units
Geography matters Population density
Randomness, ‘representativity’ and unit of analysis • Random samples more likely to be statistically representative • Randomness statistics can be used to calculate sampling errors, i.e. how far is the sample from the population • Is there a sample frame? Is it up-to-date / accurate? • How do we generalise our results to the population? Sampling weights • Choosing units of observation in a development context: is the household an unproblematic ‘unit’?
Types of interview in quantitative research • Structured (general) • Questionnaire based • Semi-structured with some closed questions
Conducting a structured interview:some key pointers • Introducing research (issues of anonymity etc.) • Clear instructions and navigating questionnaire (e.g. filter questions) • Question order (keep same order for all interviewees; from general to specific etc.) • Probing and prompting (but careful with ‘leading’ the respondent) • Training and supervision of enumerators/interviewers
Non-sampling errors • Interviewer bias: • leading the interviewee • errors in recording or measurement or interpretation of answer • omitting questions • not respecting question wording / bad translation a study showed that interviewers deviated from their script on 20 to 40% of questions in a survey • Interviewee bias: • Lies (variety of reasons – sensitive questions) • no response • Interpretation of questions • social desirability bias • response sets desire for consistency by respondent • Bad questionnaire design
Questionnaire design Length: ‘as many Q as necessary and as few as possible’ Simplicity & clarity Layout (easy to read, clear instructions, leave space for comments) / format… Careful with wording, ambiguous words, multi-purpose questions, inappropriate emphasis etc. – see below Codification binomial, multinomial, scale, etc. accurate (relevant to Q), exhaustive (all possible options), mutually exclusive (if one only) and unidimensional sets (very, or un- of the same) Types of questions: open, closed, primary, secondary, tertiary, probes, filter – contingency, threatening or not (leading to social desirability bias)
Relevance to research questions Avoid ambiguity Avoid double-barrelled or long multi-purpose questions, keep focus Avoid general / vague questions Avoid leading / suggestive questions – ‘induced’ responses Careful with effects of wording Friendly attitude to respondents Avoid subjective questions if facts can be recorded instead Avoid questions with negatives Avoid technical terms (adapt to language of respondents) Adapt questions to local customs, respondents’ knowledge and local language terms Avoid use of acronyms Avoid overlapping codified responses Importance of pilot testing questionnaires Avoid q on hypothetical / future intentions Basic rules with questions
Welcome PDAs Sampling and locating respondents Questions and data processing on the spot
Checklist of issues in survey design • What are my research questions? And hypotheses? • What the key variables and indicators? What kind of analysis • Selecting respondents: what kind of sample? How large? What method? Cost and logistics (budgeting) • Is there a suitable sampling frame? • Developing research instruments • Testing research instruments in the field • Do we need enumerators? Yes: • Selection process • Training (theoretical and a lot of practical) • Team building • Monitoring and supervision • Testing instruments again • Data processing: in the field? Do we use PDAs? What software? Do we need processors? Selection, training... • Data cleaning: consistency checks (in-built ahead of processing?), going back to questionnaires • Data analysis framework/plan (tabulation plan)