Download
1 / 24
240 likes | 288 Vues
This study explores the connection between physical measures of water quality and the value of water resources for recreation. By understanding this linkage, it becomes possible to set water quality standards and prioritize restoration efforts effectively. The Iowa Lakes Valuation Project is a collaborative initiative involving economists and ecologists studying 132 lakes in Iowa to assess the economic impact of water quality improvements on recreational activities. The study involves collecting survey responses on trip behavior, perceptions regarding lake quality, and willingness to pay for quality improvements. The findings suggest that recreational trips are influenced by water clarity and nutrient levels, providing valuable insights for prioritizing clean-up activities to maximize recreation benefits within budget constraints.

E N D
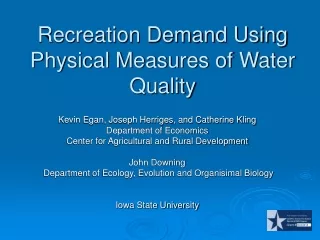
R830818 Recreation Demand Using Physical Measures of Water Quality Kevin Egan, Joseph Herriges, and Catherine Kling Department of Economics Center for Agricultural and Rural Development John Downing Department of Ecology, Evolution and Organisimal Biology Iowa State University
Linking Recreational Values to Physical Water Quality • Regulatory considerations, such as TMDL standards, require developing physical water quality standards. • Yet the linkage between the physical measures of water quality and the values associated with water resources is poorly understood. • Recreation demand models have found water quality matters, but have typically had to rely on limited measures, such as • Catch rates (e.g., Chen, Lupi, and Hoehn, 1999), • Toxin levels (Phaneuf, Kling and Herriges, 2000), or • Water quality indicators (Parsons, Helm, and Bondelid, 2003) • Understanding the linkage between physical attributes and water quality values is important to • setting water quality standards • prioritizing restoration efforts
Iowa Lakes Valuation Project • Collaborative project involving economists and ecologists studying Iowa lakes • Builds off of existing 5 year study of the ecological conditions of 132 lakes in Iowa (2000-2004) • EPA Star grant augments work begun with Iowa DNR funding and CARD support – 4 year project • A four-year panel data set of survey responses will be collected involving • Actual trip behavior and future expected trips, years 2001-2006 • 2nd through 4th year survey will contain water quality scenarios measuring WTP for quality improvements • Knowledge and perceptions regarding lake quality
Baseline Survey • First of four mail surveys • 8000 Iowa residents selected at random • Survey collected • trip data for 132 lakes • 2001 and 2002 actual trips • 2003 anticipated trips • attitudes regarding lake quality • Socio-demographic data • 62.1% response rate
Figure 2: Average number of day trips 62.8% of Iowa households took at least one trip
Modeling Issues • Randomly divided sample into three segments: • Specification • Estimation • Prediction • Modeling approach: repeated mixed logit • Specification considerations • Inclusion/exclusion of specific water quality measures • functional form (e.g., linear, quadratic or logarithmic) • random versus fixed parameters
Repeated Mixed Logit Conditional on the parameter vector, , the probability of observing that Individual i chooses alternative j on choice occasion t follows the standard logit form: The corresponding unconditional probability, , is obtained by integrating over an assumed probability density function for the assuming i.i.d. so that
Figure 8: Lake zones 5 4 7 10 2 1 8 3 6 9
Conclusions • Recreator’s trip behavior is responsive to physical measures of Water Quality • Better water clarity increases recreational trips • Nutrients decrease recreational trips • Allows consumer surplus measures to directly be linked to physical water quality improvements • Iowans value more highly a few lakes with superior water quality over all recreational lakes at an adequate level • Findings allow prioritization for clean-up activities to generate the greatest recreation benefits for a given expenditure • Rank which lakes and in what order and most efficient levels of improvement
Next Stages of Project • 2003 Survey gathered • A second year of trip data • Perceptions data regarding water quality • Stated preference data regarding water quality improvements • 2004 Survey is currently in development