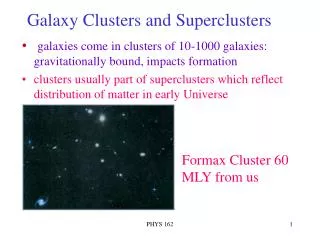
Metal abundance evolution in distant galaxy clusters
120 likes | 271 Vues
Metal abundance evolution in distant galaxy clusters. Alessandro Baldi Astronomy Dept. - University of Bologna INAF - OABO. In collaboration with: S. Ettori (INAF-OABO) , I. Balestra (MPE-Garghing) , S. Molendi, F. Gastaldello (INAF-IASF Milano) , P. Tozzi (INAF-OATS).

Metal abundance evolution in distant galaxy clusters
E N D
Presentation Transcript
Metal abundance evolutionin distant galaxy clusters Alessandro Baldi Astronomy Dept. - University of Bologna INAF - OABO In collaboration with: S. Ettori(INAF-OABO), I. Balestra(MPE-Garghing), S. Molendi, F. Gastaldello (INAF-IASF Milano),P. Tozzi (INAF-OATS)
Measures of metal content at high z • Balestra et al. (2007) obtained single emission-weighted estimates of 56 clusters (at 0.3 < z < 1.3) from Chandra and XMM-Newton • Measuring Fe abundance within (0.15-0.3) Rvirthey found a negative evolution of Z(Fe) withz: • Z(Fe) ≈ 0.4 Z☼ at 0.3 ≤ z ≤ 0.5 • Z(Fe) ≈ 0.25 Z☼ at z ≥ 0.5 • This result has been confirmed by Maughan et al. (2008) on a sample of 116 Chandra clusters at 0.1 < z < 1.3, where Z drop by 50% between z=0.1 and z≈1 • This evolution is not simply driven by the appearance or disappearance of the cool cores Maughan et al. (2008)
XMM-Newton high redshift cluster sample • We selected a sample of 40 galaxy clusters at 0.4 < z < 1.4 from the XMM-Newton archive. • Taking advantage of EPIC XMM-Newton high throughput and effective area, we performed a spatially resolved spectral analysis of the clusters in the sample. • The aim of this work is to determine if the decrease of Z with redshift observed by Balestra et al. & Maughan et al. is due entirely to physical processes associated with the production and release of Fe into the ICM, or partially associated with a redistribution of metals connected to the evolution of cool cores.
Spectral analysis results Baldi et al. 2011 in prep. • Each cluster was analyzed in 3 spatial bins, extracting spectra and fitting an XSPEC mekal model at: • r < 0.15 r500 • 0.15 r500 < r < 0.4 r500 • r > 0.4 r500
Spectral analysis results Baldi et al. 2011 in prep. We averaged the abundance in 3 different redshift bins: • 0.4 < z < 0.5 • 0.5 < z < 0.7 • 0.7 < z < 1.4 Abundance evolution can be observed in all three spatial bins: • Zz-0.3 for r < 0.15 r500 • Zz-0.8 for 0.15 r500<r<0.4 r500 • Zz-0.5 for r > 0.4 r500 r < 0.15r500 0.15r500 < r < 0.4r500 r > 0.4r500
What can IXO do for you? • We performed simulations with different IXO instruments using the SIMX simulation tool and XSPEC. • Although for clusters at z < 0.5 the field of view of the X-ray Microcalorimeter Spectrometer (XMS) would not allow to observe farther than 0.7-0.8r500, the higher energy resolution respect to the Wide Field Imager (WFI) would be crucial to measure the abundances. • The XMS instrument represents the best possible choice to observe abundances in galaxy clusters at high redshift. • We performed 50ksec XMS spectral simulation for all the galaxy clusters in our sample with XSPEC.
IXO spectral analysis results • Each simulated XMS cluster spectrum (with the same spatial bins as in XMM analysis) was fitted with an XSPEC mekal model
IXO spectral analysis results • We averaged the abundance in the same redshift bins used in the XMM analysis: • 0.4 < z < 0.5 • 0.5 < z < 0.7 • 0.7 < z < 1.4 • The smaller errors would allow to determine with a high degree of confidence if an evolution in abundance in all 3 spatial regions is present. • A larger number of redshift bins could also be used.
IXO: Individual elements abundance Ne O Mg Si S EPIC pn 11ks XMS 50ks Fe K IRAS090104 (z=0.442) Z = 0.45 Z The high S/N and energy resolution of XMS would allow to investigate the evolution in abundance of the individual elements out to z≈1
IXO: Individual elements abundance Si Mg S Fe
IXO: Abundance ratios and SN yields [Mg/Fe] [Si/Fe] [S/Fe] Theabundance ratios between elements and Fe would allow the comparison with the metal abundance yields expected from different SN types and therefore to study the history of ICM enrichment through SNIa and SNII.
Summary We presented a sample of 40 galaxy clusters at 0.4<z<1.4 extracted from the XMM-Newton archive. A spatially resolved spectral analysis of the clusters in the sample revealed hints of an evolution in abundance not limited to the cluster cores, but involving also regions farther than 0.4 r500 from the center, extending the results of Balestra et al. (2007) and Maughan et al. (2008). IXO XMS spectral simulation of the clusters in the sample showed how the high count statistics expected could test with a higher degree of confidence for the presence of an evolution in abundance. Abundance of individual elements could also be measured with small statistical errors down to z≈1, allowing to trace the ICM enrichment history through SNIa and SNII.