Download

1 / 82
820 likes | 998 Vues
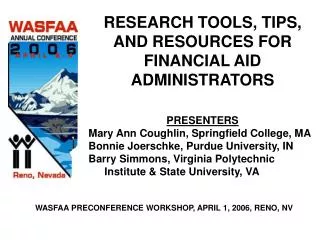
RESEARCH TOOLS, TIPS, AND RESOURCES FOR FINANCIAL AID ADMINISTRATORS. PRESENTERS Mary Ann Coughlin, Springfield College, MA Bonnie Joerschke, Purdue University, IN Barry Simmons, Virginia Polytechnic Institute & State University, VA.

E N D
RESEARCH TOOLS, TIPS, AND RESOURCES FOR FINANCIAL AID ADMINISTRATORS • PRESENTERS • Mary Ann Coughlin, Springfield College, MA • Bonnie Joerschke, Purdue University, IN • Barry Simmons, Virginia Polytechnic • Institute & State University, VA SASFAA PRECONFERENCE WORKSHOP, FEBRUARY 11, 2007, NASHVILLE, TN
INTRODUCTION AGENDA 9:00 a.m. Introduction and Goals 9:10 a.m. Why Conduct Research 9:30 a.m. COOL Demonstration 10:00 a.m. EXPT Demonstration 10:30 a.m. BREAK 10:45 a.m. PAS Demonstration 12:00 p.m. LUNCH 12:45 p.m. National/Regional/State Sources 1:15 p.m. Institutional Sources 1:30 p.m. Research Tools 2:00 p.m. Hands On Exercises 2:50 p.m. Wrap Up 3:00 p.m. Close
GOALS • Become familiar with information on your campus, the internet, or from external sources that will help you answer questions about your aid recipients or funds. • Learn how to build comparative data. • Provide an overview of available and frequently used financialaid databases and their limitations.
Why Research? • Compliance • Federal Quality Assurance Program • FISAP • Donor Relations • Defend/Support/Eliminate Programs • Program Creation
Benchmarking • Comparison group can be • Peer • Aspirational • Competitor • Predetermined
Program Creation Process • Determine/Goal Outcome • Build Conceptual Framework • Secure Funding • Develop Infrastructure • Implement Infrastructure • Evaluate Infrastructure Outcomes
NATIONAL/REGIONAL/STATE SOURCES • Common Data Set – CDS • Postsecondary Education Opportunity: Tom Mortenson’s Pell Report Card • U.S. Department of Education • Federation of State Public Interest Research Groups (PIRG) • The College Board
NATIONAL/REGIONAL/STATE SOURCES • Grapevine • The Institute for College Access and Success • U.S. Department of Labor, Bureau of Labor Statistics • State Grant Agencies or Higher Education Authority, Guarantors, etc. • NASFAA
NATIONAL/REGIONAL/STATE SOURCES Common Data Set: www.commondataset.org • Collaborative effort between colleges and publishers (College Board, Peterson’s, and U.S. News & World Report) to provide standard data items and definitions • Set of standards and definitions of data items (not a survey instrument or set of data in a database.
NATIONAL/REGIONAL/STATE SOURCES—COMMON DATA SET • Excellent source of information specific to an individual institution (e.g., financial need, indebtedness, need-based aid; grant or scholarship aid; self help aid, etc.) • No central location of data; must search individual school’s website for comparative data • Caution: school’s definition of a type of aid may differ from yours; requests completed data either for the prior year or estimated data for the current academic year. Be sure to compare same academic year data.
NATIONAL/REGIONAL/STATE SOURCES—COMMON DATA SET Sect. A General Information Sect. B Enrollment Data Sect. C First-Time Freshmen Sect. D Transfer Activity Sect. E Academic Offerings Sect. F Student Life Sect. G Expenses Sect. H Financial Aid Sect. I Faculty/Class Size Sect. J Degrees Conferred
NATIONAL/REGIONAL/STATE SOURCES—Common Data Set • Completing the Common Data Set” A Guide for Financial Aid Professionals, NASFAA Monograph Number 19, May 2006 • Reports on some of the concerns in collecting and reporting data • Provides advice on how to complete the college costs and financial aid reporting requirements • Provides terminology and data definitions
NATIONAL/REGIONAL/STATE SOURCES • Postsecondary Education Opportunity (The Mortenson Research Seminar on Public Policy Analysis of Opportunity for Postsecondary Education. • Password protected spreadsheets on the website (www.postsecondary.org) contain data on financial aid packages, gender, Pell Grants sorted by state, family income, etc.) • Source of data: National Center for Education Statistics (NCES)
NATIONAL/REGIONAL/STATE SOURCES U.S. Department of Education • Numerous data bases besides COOL/EXPT or PAS. Including • NSLDS • COD Reports • National Center for Education Statistics (NCES) • National Education Data Resource Center (NEDRC) tables • Quick Tables • Data Analysis System (DAS) • Central Processor: draws a sample of applicants quarterly for QC and research purposes
NATIONAL/REGIONAL/STATE SOURCES • Federation of State Public Interest Research Groups (PIRGs) www.uspirg.org/home/ • Data on student aid, college costs, textbook prices, and student debt • Links to individual state PIRGs • The College Board www.collegeboard.org • Trends in College Pricing: national trends in the cost of attendance; tuition discounts, etc. • Trends in Student Aid: annual data on amount of financial aid distributed to students
NATIONAL/REGIONAL/STATE SOURCES • Grapevine www.coe.ilstu.edu/grapevine • Reports on state tax appropriations for the new fiscal year • Available tables include: state tax appropriations per capita; appropriations per $1,000 of personal income; state rankings on one, two, five and ten-year percentage changes; annual average five-year percentage changes in state tax appropriations; and state tax appropriations by region. • Also includes a 50-state summary table showing total state tax appropriations for the current year and percent of changes over time (1, 2, 5, and 10 years).
NATIONAL/REGIONAL/STATE SOURCES • The Institute for College Access and Success www.economicdiversity.org • First publicly available source of campus-level data on student income, race and ethnicity, and student loan usage that can be compared over time and across institutions. • 200 different data elements for 3,000 colleges • Summary page available for institutional profiles • Comparison tool builds tables from selected variables at the state, regional or national level. Table can be printed or downloaded into Excel files.
NATIONAL/REGIONAL/STATE SOURCES • U.S. Dept. of Labor, Bureau of Labor Statistics www.bls.gov/cpi. Provides an inflation calculator as well as individual indices for goods and services
NATIONAL/REGIONAL/STATE SOURCES • State Grant Agencies or Authorities, Guarantors, etc. • Source of state level data for colleges and universities • For example: The Indiana Commission for Higher Education provides a series of reports that contain information about Indiana postsecondary education. • The “CHE Dynamic Report” soon to be available will allow users to make multiple selections for personalizing report information and analysis.
NATIONAL/REGIONAL/STATE SOURCES • National Assn. of Student Financial Aid Administrators (NASFAA) www.nasfaa.org • Annotated Bibliography of Student Financial Aid: summaries of student aid research • National Profile of Federal Student Aid Programs: information about each program, number of students served and appropriations. • Research Tools, Tips & Resources for Financial aid Administrators • Staffing and Salary Tools & Models • So You’d Like to Do Some Research—An Introduction to the New ERIC (Education Resources Information Center)
INSTITUTIONAL SOURCES • Annual Reports • Data Digests • Fact Books • Data Warehouses • Digital Dashboard (Desktop)
INSTITUTIONAL SOURCES • Annual Report • Key document that delivers information about your department • Various formats • Can be overwhelming task to create one • Tips: • Create a schedule for writing and production • Involve members of staff--you do not have to do it alone • Determine your target audience • Determine the theme/content of your report
INSTITUTIONAL SOURCES • Annual Report • Excellent on-line source: “Creating an Annual Report in Microsoft Word”, State Library of Iowa, www.silo.lib.ia.us/for-ia-libraries/tell-library-story/Props/annual-reports/index.htm • They state: “Annual reports are used by all kinds of institutions. . .as a public relations piece. They are a way of being accountable and proving your value. They can tell statistical stories, but they should also include some of the memorable highlights of the year…”
INSTITUTIONAL SOURCES—DATA DIGESTS • Used by many post secondary institutions as their official source of data. • Purdue University—West Lafayette Data Digest provides information on: • General facts and figures • Student data • Instruction and student life • Faculty and staff data • Finance facilities • Research www.purdue.edu/DATADIGEST/
INSTITUTIONAL SOURCES • Fact Books • Similar to Data Digests: a structured presentation of information about the institution frequently requested by students, faculty, staff, and other publics. • Data Warehouses • Computer-based information systems that contain data that originated from another application or an external system or source.
INSTITUTIONAL SOURCES • Data Warehouses • Managers use them to extract information quickly and easily • “Read only”, integrated databases designed to answer comparative and “what if” questions • Unlike operational databases that are set up to handle transactions and are kept up to date as of the last transaction, data warehouses are analytical, subject-oriented and structured to aggregate transactions as a snapshot in time. Useful in analyzing historical transaction data to detect patterns and trends. Source: Minnesota State Archives at www.mnhs.org/preserve/records/dwintro.html
INSTITUTIONAL SOURCES • Digital Dashboard (Desktop) • Resembles a car’s dashboard, organizing and presenting information that is easy to read. • Integrates information from various components into a dashboard • Graphics turn volumes of data into something easy to read and understand. Helps the user focus on data important to their operation. • Many companies offer dashboard technology (e.g., Microsoft).
INSTITUTIONAL SOURCES • Digital Dashboards: additional reading • “Digital Dashboards: Driving Higher Education Decisions”, Educause Center For Applied Research, Research Bulletin, Volume 2003, Issue 19, Sept. 16, 2003. • “Tracking Key Performance Indicators with a Digital Dashboard”, by Leonard Gude, NASFAA Student AidTranscript, Volume 17, No. 2, 2006.
TOOLS • ISIR Analysis Tool • Designed by Federal Student Aid (FSA) to help financial aid administrators improve the accuracy of ISIR information used to determine student eligibility for need-based aid. • Use by non-QA schools does not release them from federal verification requirements.
TOOLS • ISIR Analysis Tool • Steps to conduct a meaningful analysis of changes in ISIR data • Define the goal of your analysis • Determine relevant records to be analyzed • Decide which reports to run • Run the reports and review results • Apply improvements • Participant’s Guide located at ifap.ed.gov/qahome/guidance.html
TOOLS • Excel • Trend Analysis • Comparative Analyses • Charts and Graphs for Annual Reports • Digital Dashboards • Pivot Tables
Tools • Access • Crystal Reports • Brio • Excel - Pivot Table