Download
1 / 61
610 likes | 772 Vues
Information Visualization in Medical Informatics Ben Shneiderman ben@cs.umd.edu @ benbendc Founding Director (1983-2000), Human-Computer Interaction Lab Professor, Department of Computer Science Member, Institute for Advanced Computer Studies University of Maryland College Park, MD 20742.

E N D
Information Visualization in Medical InformaticsBen Shneiderman ben@cs.umd.edu @benbendcFounding Director (1983-2000), Human-Computer Interaction LabProfessor, Department of Computer ScienceMember, Institute for Advanced Computer StudiesUniversity of MarylandCollege Park, MD 20742
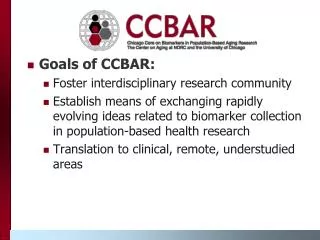
Interdisciplinary research community - Computer Science & Info Studies - Psych, Socio, Poli Sci & MITH (www.cs.umd.edu/hcil)
Design Issues Input devices & strategies Keyboards, pointingdevices,voice Direct manipulation Menus, forms, commands Output devices & formats Screens, windows, color, sound Text, tables, graphics Instructions, messages, help Collaboration &Social Media Help, tutorials, training Search www.awl.com/DTUI Fifth Edition: 2010 • Visualization
Information Visualization & Visual Analytics • Visual bands • Human percle • Trend, clus.. • Color, size,.. • Three challe • Meaningful vi • Interaction: w • Process mo 1999
Information Visualization & Visual Analytics • Visual bandwidth is enormous • Human perceptual skills are remarkable • Trend, cluster, gap, outlier... • Color, size, shape, proximity... • Three challenges • Meaningful visual displays of massive da • Interaction: widgets & window coordinati • Process models for discovery 1999 2004
Information Visualization & Visual Analytics • Visual bandwidth is enormous • Human perceptual skills are remarkable • Trend, cluster, gap, outlier... • Color, size, shape, proximity... • Three challenges • Meaningful visual displays of massive data • Interaction: widgets & window coordination • Process models for discovery 1999 2004 2010
Business takes action • General Dynamics buys MayaViz • Agilent buys GeneSpring • Google buys Gapminder • Oracle buys Hyperion • Microsoft buys Proclarity • InfoBuilders buys Advizor Solutions • SAP buys (Business Objects buys Xcelsius & Inxight & Crystal Reports ) • IBM buys (Cognos buys Celequest) & ILOG • TIBCO buys Spotfire
1M-pixels & less Small mobile devices
Information Visualization: Mantra • Overview, zoom & filter, details-on-demand • Overview, zoom & filter, details-on-demand • Overview, zoom & filter, details-on-demand • Overview, zoom & filter, details-on-demand • Overview, zoom & filter, details-on-demand • Overview, zoom & filter, details-on-demand • Overview, zoom & filter, details-on-demand • Overview, zoom & filter, details-on-demand • Overview, zoom & filter, details-on-demand • Overview, zoom & filter, details-on-demand
Information Visualization: Data Types 1-D Linear Document Lens, SeeSoft, Info Mural 2-D Map GIS, ArcView, PageMaker, Medical imagery 3-D World CAD, Medical, Molecules, Architecture Multi-VarSpotfire, Tableau, Qliktech, Visual Insight Temporal LifeLines, TimeSearcher, Palantir, DataMontage Tree Cone/Cam/Hyperbolic, SpaceTree, Treemap Network Pajek, UCINet, NodeXL, Gephi, Tom Sawyer InfoVizSciViz. infosthetics.com visualcomplexity.com eagereyes.org flowingdata.com perceptualedge.com datakind.org visual.ly visualizing.org infovis.org
LifeLines: Patient Histories www.cs.umd.edu/hcil/lifelines
LifeLines2: Align-Rank-Filter & Summarize www.cs.umd.edu/hcil/lifelines
LifeLines2: Align-Rank-Filter & Summarize www.cs.umd.edu/hcil/lifelines2
LifeFlow: Aggregation Strategy Temporal Categorical Data (4 records) LifeLines2 format Tree of Event Sequences LifeFlow Aggregation www.cs.umd.edu/hcil/lifeflow
EventFlow Team: Oracle support www.cs.umd.edu/hcil/eventflow www.umdrightnow.umd.edu/news/umd-research-team-developing-powerful-data-visualization-tool-support-oracle
Treemap: Gene Ontology • Space filling • Space limited • Color coding • Size coding • - Requires learning (Shneiderman, ACM Trans. on Graphics, 1992 & 2003) www.cs.umd.edu/hcil/treemap/
Treemap: Smartmoney MarketMap www.smartmoney.com/marketmap
Market mixed, February 8, 2008 Energy & Technology up, Financial & Health Care down
Treemap: WHC Emergency Room (6304 patients in Jan2006) Group by Admissions/MF, size by service time, color by age
Treemap: WHC Emergency Room (6304 patients in Jan2006) (only those service time >12 hours) Group by Admissions/MF, size by service time, color by age
Treemap: Nutritional Analysis www.hivegroup.com
Office of National Coordinator: SHARP Strategic Health IT Advanced Research Projects - Security of Health Information Technology - Patient-Centered Cognitive Support - Healthcare Application and Network Platform Architectures - Secondary Use of EHR Data Univ of Maryland HCIL tasks - Missing Laboratory Reports - Medication Reconciliation - Wrong Patient Errors www.cs.umd.edu/hcil/sharp
Lab test tracking to ensure completion Define tracking processes Assign temporal responsibility Define possible actions Predict expected duration Generate User Interface from processes Enhance situation awareness Integrate follow-up actions with results Simplify rapid operations Provide retrospective analysis PhD work: SureyyaTarkan