GIFTS
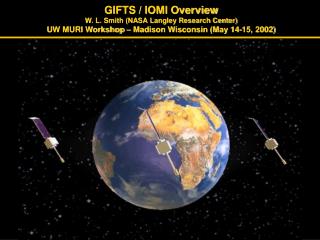
GIFTS / IOMI Overview W. L. Smith (NASA Langley Research Center) UW MURI Workshop – Madison Wisconsin (May 14-15, 2002). A revolutionary weather forecasting tool. GIFTS. New Technology for Atmospheric Temperature, Moisture, & Winds. 4-d Digital Camera:.

GIFTS
E N D
Presentation Transcript
GIFTS / IOMI Overview W. L. Smith (NASA Langley Research Center)UW MURI Workshop – Madison Wisconsin (May 14-15, 2002)
A revolutionary weather forecasting tool GIFTS New Technology for Atmospheric Temperature, Moisture, & Winds 4-d Digital Camera: Horizontal: Large area format Focal Plane detector Arrays Vertical: Fourier Transform Spectrometer Time: Geostationary Satellite
GIFTS Sampling Characteristics • Two 128x 128 Infrared focal plane detector arrays with 4 km footprint size • One 512 x 512 Visible focal plane detector array with 1 km footprint size • Field of Regard • 512 km x 512 km at satellite sub-point • 11 second full spectral resolution integration time per Field of Regard
High Spectral Resolution Sounding Michelson Interferometer (FTS) Interferogram Fixed Mirror d1 Beam Splitter Moving Mirror Source d2 Detector (d2-d1) Fourier Transformation Numerical Inversion Vertical Sounding Radiance Spectrum Fourier Transform Spectrometer (FTS) Provides Simultaneous Measurement of the Vertical Dimension
GIFTS IR Measurements Wavelength (m) Wavelength (m) Wavenumber(cm-1) Wavenumber(cm-1) Shortwave IR Focal Plane: (4.4 to 6.1 microns) Water vapor sounding Carbon Monoxide profiling Boundary layer temperature sounding Surface temperature Stratus cloud detection • Longwave IR Focal Plane: • (8.8 to 14.6 microns) • Temperature sounding • Ozone profiling • Cloud altitude • Surface temperature • “Invisible” cirrus cloud detection
GIFTS Visible Measurements Rapid Full Disk & Regional Views High Resolution (1km) Visible Imagery: cloud and surface features land-mark navigation
Roadmap to Next Generation Studies Laboratory Demonstration Aircraft Water Vapor Tracer Wind Demonstration Future Geo-Sats GIFTS-IOMI
GIFTS-IOMI Benefits NASA Technology Transfer & Measurement Concept Validation NOAA Next Generation Geo-Satellite Applications Readiness Navy Image Product Utility to the Fleet Science & Technology Infusion Revolutionary Weather Observations by Next Generation Operational Meteorological Satellite Systems
Contributions NASA GIFTS Instrument & Supporting Technologies (~105 M) NOAA US Ground System, Algorithms, Data Processing & Archive (~40 M) Navy Spacecraft & Instrument Lifetime Enhancements (~70 M) Air Force (STP) Launch Vehicle & Launch Services (~65 M) Australia (BoM) IO Ground System, Data Processing & Archive (~20 M) Revolutionary Weather Observations Validation of Next Generation Geostationary Meteorological Satellite System (~300 M)
Indian Ocean Ops TECHNOLOGY GIFTS-IOMI Project Concept VALIDATION Imaging Interferometer Cryogenic Michelson Interferometer Laser Metrology System On-Board Calibration LFPA and Cryogenic Cooling 128 x 128 Infrared Detector Arrays Redundant Cryo-Coolers High Speed Signal Processing Rad-Hard Analog to Digital Converters PowerPC Rad750 Data Compression Rad-Hard Processors Pointing and Control Star Tracker 512 x 512 Visible Detector Array Lightweight Optics SiC Telescope INFUSION NASA - Demonstrate Wind Sounding Measurement Concept & Validate the Technologies NOAA - Demonstrate Operational Utility & Infuses Technology into NOAA instruments Navy - Provides Advanced Imaging/Sounding Data Products for Fleet Operations
NOAA Product Assessment Plan AFO CIMSS (Archive) JCSDA AWC WFO Wallops SPC HPC HFO
NOAA/NASA Data Centers Naval Shipboard and Shore Assets Data to Naval Centers/ Fleet Demo DOE ARM Validation Site CONUS “1” CONUS “2” Indian Ocean “3” GIFTS-IOMI Mission Summary E. Pacific, W. Atlantic, Indian Ocean– MC Validation - Impact on prediction of NA Winter Storms. Research data sets during THORpex - Impact on nowcasting and numerical prediction of severe convective storm development and hurricane formation, track, and landfall position forecasts - Impact on support of Navy fleet and other DoD tactical operations - Impact on Australian region mesoscale predictions - Asian Monsoon life cycle research data sets - Impact on global numerical weather prediction - Geostationary satellite support of EOS science missions (i.e., Aqua Train Cloud/Aerosol Radiation Feedback Mission and Aura CHEM mission). “1” “2” “3” Australian Data Center
GIFTS at IOMI Position (75 E) First doubling (Sounding limit) Horizon Comm limit, 5 degrees above horizon Comm limit, 11 degrees above horizon
GIFTS Fills Important Data Void GIFTS-IOMI (USA) 75º E
GIFTS Example Modes of OperationAssumes 0.83cm/11sec Michelson mirror scan velocity plus 1sec scene mirror step time “Global” Hi Res. Sounding: 300 Steps Spectral Resolution: 0.6 cm-1 Hi Res. Mesoscale Sounding: 36 Steps Global Sounding-Imagery: 422 Steps Spectral Resolution: 0.6 cm-1 Spectral Resolution: 16cm-1 Hi Res. Sounding Regional: 144 Steps 1/2 Hr (Sounding-Imagery < 5 min) 1 Hr Spectral Resolution: 0.6cm-1 7 min (Sounding-Imagery < 1 min) 10 Min
Meeting Navy METOC Requirements (1) >50 Channels (4-6 Levels) 3 m/s
Meeting Navy METOC Requirements (2) Trace Gas Dust/Aerosol Transport Tropospheric
Addressing Operational Navy METOC Priorities • A. Reliable IO Imagery • Active Sensor Program for MBL – • (note: GIFTS will provide ocean skin • temperature and MBL T &q) • C. High Refresh Imagery • Multi-Spectral Hyper-Spectral Imagery – • (note: IR sfc emissivity spectrum can be used to characterize surface conditions) • E. Tropospheric T, q, and V Sounder
“GIFTS” Capabilities - Aircraft Validation Proteus ER-2 NPOESS Aircraft Sounder Testbed- Interferometer ( NAST-I ) Spectral Range: 3.5 - 16 Microns Spectral Resolution: >2000 (0.25cm-1)
Spectral Coverage Comparison NAST-I CrIS GIFTS-LW GIFTS-SW GIFTS CO CO CO2 N2O N2OCH4 H2O N2O CH4 H2O H2O N2O CO2 H2O CO2 O3 O3 CO2 H2O NAST-I spectral coverage encompasses that of GIFTS
Radiosonde Validation Andros Is. Bahamas, Sept 12, 1998 Raob NAST Altitude (km) Relative Humidity (%) 3km Distance (75 km)
Spatial (~22km) & Temporal (~2-3hr) Temperature Variation Over Purcell ARM CART-Site Sounding Validation C P D Sfc Temp (21Z) A P B Space & Time Variability Sfc Temp (19Z)
VERTICAL PROFILE COMPARISONS NOV 30 NOV 30 NOV 30 DEC 05 DEC 05 DEC 05
Proteus NAST-I Vertical Cross-section (CLAMS 7/12/01) 16.0 UTC 13.8 14.9 This flight demonstrates the ability to observe the spatial moisture structure below a scattered and semi-transparent Cirrus cloud cover
Effects of Opaque Cloud on Retrieval Cloud () Spectral Minimization 11µm () Cloud () Spectral Minimization () = (Ic-Im)/ Flight Track
Vertical Cross-section (July 26, 2001) Clouds Clouds Clouds CLOUDS CLOUDS CLOUDS IR Window Image Along Track If Clouds Are Included in EOF Regression Training then Cloud Effects On Clear Air Sounding Above the Clouds are Alleviated
Proteus Flight Track (July 10, 2001) Horizontal Resolution and Precision Characteristics of NAST-I Surface Temperature
Proteus NAST-I Vertical Cross-section(CLAMS 7/10/01) IR Window Image Along Track
Surface Skin Temperature (July 14, 2001) Surface Skin Temperature °K Chesapeake Lighthouse 296.52º K ( = 0.54º K)NAST-I retrieved (within 0.1 Lat. and Lon.) 297.45º K NOAA buoy site CHLV2 measured bulk SST The cool “skin”, observed by NAST-I, relative to the sub-surface water, observed by the buoy, is expected as a result of evaporative cooling.
EOF Surface Emissivity Retrieval* (July 14, 2001) *Based on 5 EOF Representation of Salsbury Laboratory Measurement Emissivity Data Set 8.6 µm 11 µm Seawater Emissivity Lab Retrieved
Can GIFTS Observe the Optical Depth of Dust Plumes ? Asian Dust Event on 3/12/2001 (Sokolik,2001) Dust NAST-I track Clear Slope via Brightness Temperature (at 890 cm-1)(about 2000 NAST-I spectra) + Brightness Temperature Slope 0 dust causes a negative Tb slope across “Window” region Dust - 12m 10m Tb Wavelength
Summary • The NAST provides high spatial resolution radiance measurements which can be used to validate the radiometric accuracy and retrieval products of GIFTS • High spatial resolution features of atmospheric temperature, moisture, and clouds will be retrieved from high spectral resolution GIFTS radiances • GIFTS will be able to profile above an opaque overcast cloud cover and above and below thin and/or broken clouds • Surface skin temperature and emissivity can be retrieved simultaneously from the GIFTS spectral radiance measurements and this is important for the retrieval of accurate lower tropospheric moisture, trace gas, and aerosol profiles