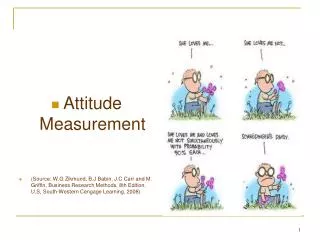
Attitude Measurement
600 likes | 1.02k Vues
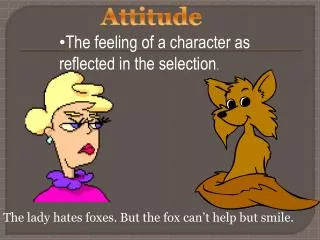
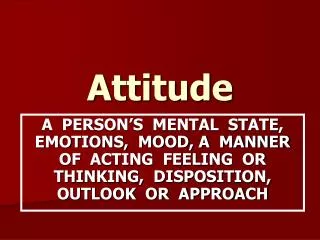
Attitude Measurement. What is an Attitude. A mental state used by individuals to structure the way they perceive the environment and guide the way they respond to it Essence of the ‘human change agent’ – influencing attitudes can influence how you behave

Attitude Measurement
E N D
Presentation Transcript
What is an Attitude • A mental state used by individuals to structure the way they perceive the environment and guide the way they respond to it • Essence of the ‘human change agent’ – influencing attitudes can influence how you behave • Great diagnostic / explanatory value – why consumers buy / don’t buy • Overwhelming amount of primary research in marketing deals in measuring attitudes
Formation of attitudes (MAAM) • Belief about a brand = Attribute x strength of its association with brand • Importance of attribute moderates belief strength • Sum of moderated beliefs = attitude to brand • Interpret the figure according to the direction of the scale • Interpret the figure relative to attitude measures for competing brands • Multi Attribute Attitude Modeling (MAAM)
Multi-Attribute Attitude Models n Ab = bi ei i = 1 Ab = attitude toward brand bi = belief about the relationship between brand and attribute i ei = attribute importance weight i n = number of salient attributes
Multi-Attribute Attitude Models Example Value Store Store Store Attribute (ei) X Y Z Wide Selection 0.3 +2 +3 +3 Low Price 0.2 +3 -2 -1 High Quality 0.3 -1 +3 +1 Convenient 0.2 +2 +2 +3 location biei for Store X: (0.3)(+2) + (+3)(0.2) + (-1)(0.3) + (+2)(0.2) = 1.3 biei for Store Y: (+3)(0.3) + (-2)(0.2) + (+3)(0.3) + (+2)(0.2) = 1.8 biei for Store Z: (+3)(0.3) + (-1)(0.2) + (+1)(0.3) + (+3)(0.2) = 1.6
Attitude Action/ Behavior Attitude Research
Three Components of Attitude Affective Component Action Component Cognitive Component
Attitude components • Cognitive component • Awareness of object • Knowledge of attributes of object • Judgments of • importance of attributes of object • Satisfaction • Etc. • Affective component • Feelings and emotions • Conative component • ‘drive’ to act / behave – motivation • Desire • Attitude is a three – dimensional construct
Ideas, Concepts, Constructs and Variables • E.g. “I want to make advertising that is “cool”, “hip” and “edgy” • Can you lay down clear boundaries between “cool”, “hip” and “edgy”?
Ideas, Concepts, Constructs and Variables • E.g. “I want to make advertising that is “contemporary” and “effective” • Can you lay down clear boundaries between “contemporary” and “effective”?
Ideas, Concepts, Constructs and Variables • 1. . E.g. How much do you like Winthrop University? • Hate it----Dislike it----neither like nor dislike ----Like it----Love it • Variable: • 2. E.g. “Did you buy the product when you last went to the store?” Y/N • Variable:
Construct An idea / concept which stands on its own In the conceptual / abstract domain E.g. attitude, satisfaction, love, romance, commitment, motivation, etc. May have several dimensions e.g. dimensions of attitude, etc. Variable The operationalization of the construct A variable can be measured E.g. the operationalization of attitude is “liking”; of romance could be “attraction” etc. If a construct has several dimensions, its variable has several factors e.g. factors of attitude, etc. Construct vs. Variable
Measurement and Scaling • Measurement – standardized process of assigning numbers / symbols to characteristics of objects according to pre-specified rules • One-to-one correspondence between the number / symbol and the characteristic • Assignment to be invariant over time and objects • Scaling – process of creating a continuum on which objects are located according to the amount of the measured characteristic they possess
Semantic Differential Scales Classification of attitude scales Attitude Scales Single-Item Scales Continuous Scales Multi-Item Scales Itemized Category Scales Comparative Scales Paired Comparison Scales Rank-Order Scales Constant Sum Scales Pictorial Scales Likert Scales Stapel Scales
Continuous Scales How would you rate Sears as a department store? Probably the worst -------------------------------------------- Probably the best Problems: Unreliable in interpretation hence not widely used
Typical Attitude Rating Scales • Single item scales – Only one item to measure the construct • Comparative • Rank order • Pictorial • Constant sum • Multi-item rating scales – More than one item to measure the construct • Likert • Semantic Differential • Stapel
Single Item rating scales • Advantages • Relatively quick, uncomplicated measurement • Relatively simple to analyze • Problems • Can one item measure all the dimensions of the construct?
Single item scales • Itemized-category scales • Labels each category on the scale • Example: • What is your overall satisfaction with McDonald’s Hamburgers • Very satisfied • Quite satisfied • Somewhat satisfied • Not at all satisfied
Single item scales • Comparative Scales – forces respondent to evaluate the object w.r.t. another, on the same attribute • Example: • Compared to Burger King, how would you rate McDonald’s Hamburgers on taste • Very superior • Superior • Neither superior or inferior • Inferior • Very inferior
Single item scales • Rank-order scales – • requires respondents to arrange a set of objects with regard to a common criterion e.g. interest in an ad, brand preferences, etc. • Closely corresponds with the choice process since buyers make direct comparisons amongst competing alternatives
Rank Order Scales Please rank the following in order of your preference where 1 = your most preferred and 9 = your least preferred. Brand A _____ Brand B _____ Brand C _____ Brand D _____ Brand E _____ Brand F _____ Brand G _____ Brand H _____ Brand I _____
What are the problems with this scale • How will you improve this scale?
Single item scales • Constant sum scaling • Allocate a fixed number of rating points amongst several objects / attributes to reflect relative preference for the objects / importance of the attributes • Multi-attribute model importance weights
Constant Sum Scale • Divide 100 points among the following attributes of a PC in terms of how important they are to you in making a purchase decision. Clock Speed: 30 Hard drive size: 20 RAM size: 10 Price: 40 TOTAL 100 Possible problems with this scale?
Single item scales • Pictorial Scales • Various levels of the scale are depicted pictorially • Generally used when surveying children / illiterate samples
Pictorial Scales • Interviewer says: Eating Honey Munch Cereal makes me feel:
Designing Scales • Number of Scale Categories • 2 to infinity (Problems?) • 5 – 7 preferred • Strength of the Anchors • colorful vs. very colorful vs. extremely colorful • Strong anchors are less likely to be used • Balance of a Scale • balanced vs. unbalanced (problems with unbalanced scales?) • Equal number of categories on both sides
Designing Scales • Types of poles used in the scale • Sweet and not-sweet vs. sweet and bitter • Problems? • Labeling of the Categories • no labels vs. some labels vs. all labels • Labeling reduces ambiguity • Labeling also causes cracks
Designing scales • Number of response alternatives • Five to seven is a good number • Two to three generally stifle responses and frustrate respondents • More than nine is superfluous • An odd number is preferred since a neutral position can be legitimately adopted • “Don’t Know” option • Use it when there is a distinct possibility • Overuse may attract responses from disinterested respondents
Multiple Item Scales • Attitudes to complex objects like cars, insurance, credit cards, etc. may have many facets • Unrealistic to expect just one item to capture all these facets • Here we use multi-item scales • Example: Attitudes to Winthrop University
Likert Scale • Require respondents to indicate their degree of agreement / disagreement with a variety of statements related to the attribute or object • Also called summated scales because scores on individual items are summed to obtain scores for respondents
Semantic Differential Scale • Used to describe a set of beliefs that comprise a person’s image of an object • Each scale item is bounded at each end by a polar adjective or phrase / bipolar adjectives or phrases • Can be spatially represented on profile maps to a clearer understanding
Semantic Differential Scale Low Price 1 High Price 1 Consistent Quality Spotty Quality Smooth Tangy Not Bitter Bitter
+3 +2 +1 -1 -2 -3 Stapel Scale +3 +3 Heavy Consistent Quality Tangy +2 +2 +1 +1 -1 -1 -2 -2 -3 -3
Accuracy of Attitude Measurements • Reliability • Does the scale perform consistently over time and over different sets of respondents? • Test-Retest reliability: administering the same scale at two different points in time to the same / different sample • Absence of reliability induces random error in the measurement • Reliability of 0.7 and above is generally good
Accuracy of Attitude Measurements • Validity • Does the scale measure what it is intended to measure? • Absence of validity induces systematic error in the measurement i.e. the scale is measuring something else over and above the construct in question (e.g. attitudes) • A valid measure is one that reflects the true score
Accuracy of attitude measurements • Observed score = true score + systematic error + random error • Hence a valid measure has both zero systematic and random errors • If random error is zero (i.e. the scale is perfectly reliable) it may still not be valid • The scale may be consistently measuring something else • Hence reliability is a necessary but not sufficient pre-condition of validity
Types of validity • Face validity – a knowledgeable conclusion about the scale validity • Convergent validity • Criterion validity – does the variable predict another variable satisfactorily • Does attitude to brand predict purchase intentions, both measured at the same time? • Predictive validity – if the DV is measured in the future • Does college GPA predict the amount of salary you earn in the future? • Does attitude to brand predict future buying behavior?
Types of validity • Discriminant validity • Is your construct different from another construct • Are attitude to brand and purchase intentions two different constructs, or the same construct with two different labels? • Effect of attitude to brand and purchase intentions on purchase behavior • Construct validity • Conclusion about the measure after testing reliability, convergent and discriminant validity
Accuracy of Attitude Measurements • Sensitivity • Ability of the scale to capture meaningful differences in attitudes • Can be achieved by increasing the levels but the greater the levels the lower the reliability • Generally 5 to 7 levels are good • Generalizability • Ease of scale administration and interpretation in different research settings • Relevance • Validity x Reliability (between 0 to 1) • Meaningfulness to measure a construct
Accuracy of Attitude Measurements • Dimensionality • Does the construct consist of only one dimension or more than one dimensions • E.g. Attitudes – 1,2 or 3 dimensions? • Measured through a factor analysis