
Imaging Nonlinearities in Superconducting Microwave Devices Using Low-Temperature Laser Scanning Microscopy
This study explores local microwave properties in YBa2Cu3O7/LaAlO3 thin-film resonators through Low-Temperature Laser Scanning Microscopy (LSM). By employing a novel procedure for analyzing complex impedance, the research reveals how inhomogeneous current flow influences nonlinear microwave response. The findings indicate that dominant sources of microwave nonlinearities localize within resistive domains linked to high current densities and structural defects. The spatial rearrangement of these sources correlates with vortex pattern redistribution under microwave fields.

Imaging Nonlinearities in Superconducting Microwave Devices Using Low-Temperature Laser Scanning Microscopy
E N D
Presentation Transcript
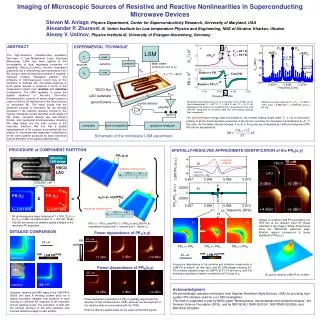
inductive reflectivity resistive IMD PR 25 mm 25 mm Imaging of Microscopic Sources of Resistive and Reactive Nonlinearities in Superconducting Microwave Devices Steven M. Anlage, Physics Department, Center for Superconductivity Research, University of Maryland, USA Alexander P. Zhuravel, B. Verkin Institute for Low temperature Physics and Engineering, NAS of Ukraine, Kharkov, Ukraine Alexey V. Ustinov, Physics Institute III, University of Erlangen-Nuremberg, Germany ABSTRACT The high-resolution, nondestructive evaluation technique of Low-Temperature Laser Scanning Microscopy (LSM) has been applied to the investigation of local microwave properties in operating YBa2Cu3O7/LaAlO3 thin-film resonators patterned into a meandering strip transmission line. By using a newly developed procedure of spatially-resolved complex impedance partition, the influence of inhomogeneous current flow on the formation of nonlinear (NL) microwave response in such planar devices is analyzed in terms of the independent impact from resistive and inductive components. The LSM capability to probe the spatial variations of two-tone, third-order intermodulation currents on micron length scales is used to find the 2D distribution of the local sources of microwave NL. The result shows that the dominant sources of microwave NL are strongly localized in the resistive domains formed by the highest microwave current densities at the edges of the strips, structural defects like twin-domain blocks, and topological inhomogeneities including the edge shape and the inner corners of the resonator structure. We find that a spatial rearrangement of NL sources is correlated with the effects of microwave-field-dependent redistribution of the vortex pattern produced by local overcritical current densities in the superconducting strip EXPERIMENTAL TECHNIQUE f a) LSM Pf1 Pf2 T1 = 80.7 K T2 = 80.9 K -IMD3 +IMD3 f1 d|S21|2 Df=1 MHz combiner laser beam (amplitude mod. at fM) isolators f0 sources 100 kHz f2 b) PIN T = 77 – 95 K Inductive PR laser Total PR Resistive PR x3 YBCO film LAO substrate ground plane f0 POUT Spectrum of output signal for Pf1 = Pf2 = +12 dBm, T = 78 K, and f1 = 5.968 GHz, f2 = 5.969 GHz, and fM = 100 kHz. Microwave transmittance |S21|2(f) of a resonator at РIN=0 dBm at two fixed temperatures T1 = 80.7 K, T2 = 80.9 K, with DT = 0.2 K, (b) difference of the traces in (a) (symbols) that is proportional to the total LSM PR, along with the inductive (solid line) and resistive (dashed line) components crystal detector amplifier switch Theabsorbed laser energy heats the sample on the thermal healing length scale, ℓT ~4 mm for bolometric probing of all the thermosensitive properties of the device, including the microwave transmittance S21(f). In this case, the thermally induced changes of S21(f) in the probe are understood as LSM photoresponse (PR) that can be expressed as: spectrum analyzer computer lock-in amplifier Schematic of the microwave LSM experiment PROCEDURE of COMPONENT PARTITION SPATIALLY-RESOLVED APPROXIMATE IDENTIFICATION of the PRR(x,y) PRR(x,y) reflective LSM image inductive LSM PR 10 mm YBCO (a) YBCO LAO resistive component resistive LSM PR x 400 LAO 1 mm LAO +2 dBm 0 dBm 300x300 mm2 (b) B PR (f1) PR (f2) 50x50 mm JRF(x,y)~sqrt(PRX) ± = A inductive contribution +4 dBm +6 dBm f1= 5.957 GHz f2= 5.977 GHz F1 F3 F2 RF photoresponse maps obtained at T = 78 K, PRF(f1) = PRF(f2) = 0 dBm, and laser power PL = 123 mW . Areas A and B are chosen for detailed spatial analysis of the resonator RF properties. Images of resistive LSM PR penetrating into HTS film at the different input HF power indicated in the images. White dotted boxes show the YBCO/LAO patterned edge. Brighter regions correspond to larger amplitude of PRR(x,y). F1 F2 F3 PR(f +) = PR(f1) and PR(f -) = PR(f2) is the LSM PR at equidistant frequencies f + (above) and f - (below) f0 DETAILED COMPARISON Power dependence of PRX(x,y) YBCO 10 mm PR peak PRX >> PRR PRX << PRR PRX >> PRR min max min max LSM PR LSM PR 0 dBm +12 dBm -12 dBm 0 Frequency dependence of (a) resistive and inductive components of LSM PR at area B, (b) their ratio, and 2D LSM images showing (F1, F3) a mainly inductive origin of LSM PR at F1, F3 far from f0, and (F2) showing a significant resistive contribution at F2 close to f0. Power dependence of PRR(x,y) LAO 25 mm 3D plot of resistive LSM PR at +6 dBm Acknowledgment We acknowledge valuable contribution from Stephen Remillard (Agile Devices, USA) for providing high-quality HTS samples used for our LSM investigation. This work is supported in part by NASU grant “Nanosystems, nanomaterials and nanotechnologies”, the German Science Foundation (DFG), and by NSF/GOALI DMR-0201261, NSF/DMR-0302596, and NSF/ECS-0322844. -12 dBm 0 dBm +12 dBm Inductive, resistive and IMD maps of the LSM PR in 50x50 mm2 area A showing evident proof for a spatial correlation between that positions of local sources of nonlinear RF response of the resonator and its resistive zones. The correlation of both with the twinned structure of the LAO substrate (see inserted reflective image) is also evident. Power-dependent penetration of PRX is spatially aligned with the direction of twin-domain blocks (TDB), whereas the development of the resistive state is uncorrelated with the TDBs. Note the different spatial scale for the upper and bottom figures.


