Comprehensive Mapping of Health Facilities for Effective Planning and Monitoring
160 likes | 300 Vues
This project aims to address the lack of accurate information on health facilities (HFs) regarding their location, functionality, service range, and human resources. Objectives include identifying HF locations, mapping them alongside nearby schools and water points, and conducting a comprehensive inventory of services, staffing, equipment, and drug supplies. The study involves designing a structured questionnaire, piloting data collection, and thorough data analysis using GPS and software tools. Results will enhance planning, monitoring, and evaluation (M&E) efforts in the health sector.

Comprehensive Mapping of Health Facilities for Effective Planning and Monitoring
E N D
Presentation Transcript
THE HEALTH FACILITY MAPPING Richard Laku
Rationale • Absence of accurate information on location, functionality and the range of service provision, manpower ( baseline information)
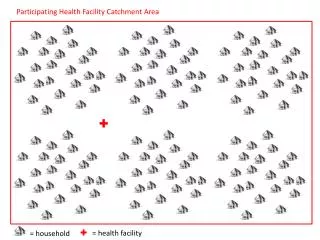
Objectives • Identify the HF locations and near by schools and water points • Develop updated maps of HF • Carry out the inventory of : • Service availability • Human resource outlay • Equipments • Drugs supplies • Training • Identify gaps to support planning and M&E
SCOPE OF WORK • Design of Instrument • Piloting of Instrument • Data Collection • Data entry • Data cleaning • Data Analysis • Documentation
Design of the Questionnaire • Questionnaire should be structured • Questionnaire has to have a unique identification code • The Questionnaire has skips • Multiple answers • Apha answers, numeric answers • Special Codes: 9=missing information, 8=Don’t know • Use of official Census Codes e.g 92=Central Equatoria, 93=Eastern Equatoria etc
Data collection • Piloted the instrument in Central Equatoria State • Use of GPS • Proper filling of the questionnaire • Collected data in systematic manner in the seven States
Data Entry • Data entry program was developed using CsPro • Program resembles questionnaire • Program has controls
Data Entry • Training to enable the data clerks to know exactly what is expected of them • Transfer of data in the questionnaire to the computer • Provide codes for data staff
Data Cleaning • Use of the verifier mode to check errors • Running of Batch programs to flash out data entry errors • Determination of outliers
Data Analysis • Transfer to SPSS for analysis • Provision of frequency tables • Provision of cross tabulations (numbers or percentages) • Provision of graphs • Data for maps
Documentation • Documentation of all the variables, controls and skips in the questionnaire • Documentation of the analysis • Challenges experienced during data collection, data entry and how they were resolved
Conclusion • Data is key in planning • Data is crucial in M&E • Absence of key variables: Gender variable, Rural/Urban classification • Further analysis can be done