Phase Formation and Performance Potential in Tube-Type Nb 3 Sn
M.D. Sumption, R.K. Dhaka, A. Madeshia, and E.W. Collings Strands from Supergenics E. Gregory H yper Tech Research, Inc . X. Peng, M.J. Tomsic. Phase Formation and Performance Potential in Tube-Type Nb 3 Sn.

Phase Formation and Performance Potential in Tube-Type Nb 3 Sn
E N D
Presentation Transcript
M.D. Sumption, R.K. Dhaka, A. Madeshia, and E.W. CollingsStrands fromSupergenicsE. GregoryHyper Tech Research, Inc.X. Peng, M.J. Tomsic Phase Formation and Performance Potential in Tube-Type Nb3Sn Supported by: The U.S. Dept. of Energy, Div. of High Energy Physics, Grant No. DE-FG02-95ER40900, and an SBIR grant via Supergenics
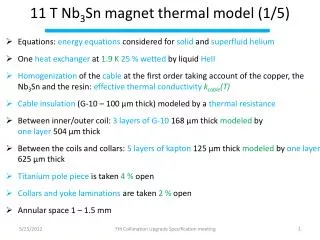
Outline Purpose –Observation and Description of Phase Formation in “Tube” Type Strands • Transport Study (Quick) • Microstructure Study • Phase Formation Systematics (Model and Data) • Layer Growth Rates • Stoichiometry and Bc2 • Estimates, Limits, and Conclusions
Tube-Type 61 and 91 Filament Multifilament Strands 61 filament 91 filament 91 filament 1026 1087 1102
Tube-Type 127 and 169 Filament Multifilament Strands 127 subelement-1135 169 Subelement -1162
Strand Specifications for Transport Study and Summary Results
Jc for various restacks • n • 44 • 169 23
Strand Specifications –Micro-structure Study (Pre-reaction)
Reacted Strands 61-1026 91-1087 169-1162
Summary Reactions (650C) • 933: NbSn2 6:5 A15 • 1025 (1026 mono): NbSn2 6:5 A15 • 1026: 6:5 A15 • 1087: 6:5 A15 • 1102: 6:5 A15
RIT Formation Route PIT Stage 1 PIT Stage 2 Ternary Diagrams – RIT and PIT
933 Reactions 0,1,5,9,16,25, 100 16 hours
1026 Reactions 0,1,5,9,16,25100 9 hours
1102 Reactions 0,1,5,9,16,25, 100 25 hours
Fine Grain A15 Coarse Grain A15
Mono (1025) Reaction Layers vs t 5 hours
61-Stack (1026) Reaction Layers vs t Fine Grain A15 Coarse Grain A15 Receding 6:5
91-Stack (1102) Reaction Layers vs t 25 hours
R4 Nb R4 Cu R3f R3p R2p L SnCu R2 R2f R1 CGA15 6:5 FG-A15 R5 R5 Time T0 – No Reaction Time TA15– Full reaction Time T6:5 – Maximal 6:5 Calculation of Reaction Radii--Definitions Three Times T0 – Time zero T6:5 – 6:5 Maximization TA15 – A15 Maximization Various Radii R1= Sn radius T0 R2= Cu radius T0 R2p= Solid/Liq boundary T6:5 R2f= Nb-rich/Cu-Sn boundary TA15 R3= Nb tube consumed T6:5 R3p= 6:5 maximal extent R3f= Coarse/Fine A15 TA15 R4= A15 maximal extent R5= Subelement radius Sn
Nb Cu R2 R1 R5 Time T0 – No Reaction The Situation at Time T0 The No. Moles per unit length of Sn is given by The No. Moles per unit length of Cu is given by Where Vs are the molar volumes
R4 R3p R2p L SnCu 6:5 R5 Situation at time T6:5 (6:5 extent) Moles/Length Sn Consumed in 6:5 formation is X is at%Sn in Cu-Sn in core at 6:5 maximization Nb-Tube Moles/Length Consumed 6:5 formation Assume (1) Nb shell is fixed boundary, (2) 6:5 “hugs” tube wall, then using CNb(6:5) = (6/5)CSn ,
Situation at time T6:5 (6:5 inner boundary) Since the Nb expands going to Nb6Sn5, and the Nb shell is the fixed point, the inner boundary of the layer shifts inward Noting that R3p=R3, and re-writing in terms of R1 and R2only,
R4 R3f R2f CGA15 FG-A15 R5 The Situation at TA15 Assuming that All Sn eventually forms A15, we have Which can be re-written as The inner boundary of the A15 moves as well, based on volume expansion is considered as Nb A15, thus Which becomes A similar consideration leads to R2f
Summary for T0, T6:5, and TA15 At T6:5 At TA15
Area fractions in Tube and RRP Area Hexagon/Area Circle = 0.90 Takes a 3000 A/mm2 2700 A/mm2 Options 1. Can live with 2700 A/mm2 2. Can make filaments round (will make Jc = 3000 A/mm2) 3. Can increase fill factor but keep filaments hex (will keep Jcat 2700 but increase Ic) A15 Unreacted Nb
Round Filament Option Jc = 3000 A/mm2, but to keep non-Cu fraction to 0.5, Cu must come in from outer regions to array region If s/d = 0.1, then in filamentary region, maximum fill factor is 0.9 * 0.9 (area loss) * (s/d factor) (1 - 0.81x) = 0.5 62% of conductor must be array Present day RRP is 50% non-Cu and 55% array.
Hex filament Option • Based on Hex filaments, we can assume 90% non-Cu in filamentary region – which requires 55% filamentary region for a 50% non-Cu. • Keep filaments hex, but increase non-Cu to 55% to make Jc the same as a 50% non-Cu 3000 A/mm2 conductor. • Filamentary region must become 62% of conductor – same as for round option
A15 and 6:5 layer growth rates in tube Conductors X = Knt1/n NA15= 0.94 KA15 = 0.083 mn/s N6:5 = 0.5 K6:5 = 2.0 mn/s
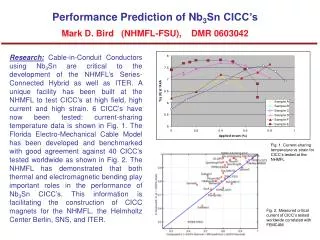
Kramer Plot Multifilamentary Strands reaching higher Bc2s – apparently higher homogeneities
Conclusions • “Tube” type strands emerging with interesting Jc, filament counts • Reaction modes similar to PIT strands, go via 6:5 predominantly, but from Cu-Sn rather than NbSn2 • Phase evolution modelled analytically, expressions for geometrical phase growth developed, as well as A15 fine grain/Coarse grain ratios – agree with experiment • Cu-Sn ratio controls Coarse/Fine A15 and hole fraction • Estimate of 2795 A/mm2 for subelement Jc at given Cu/Sn agrees well with 2700 A/mm2 experimental value • Layer growth rates measured, reaction times, Kramer Bc2 becoming good as filament sizes reduced. • At present reaction T, 3200 A/mm2 round non-Cu Jc limit, 10% reduced to 2900 A/mm2 for hex shape filaments
Crystal Structure NbSn2 Nb6Sn5 Nb = 2, Sn = 1,3 Nb = 2, 5, 6,8 Sn = 1,3, 4, 7 T. G. Ellis and H. A. Wilhelm, “Phase Equilibria and Crystallography for the Niobium-Tin System”, Journal of Less Common Metals, 7, 67-83 (1964) Pearson’s Handbook of Crystallography Data for Intermetallic Phases, P. Villars and L.D. Calvert, Metals Park, OH: American Society for metals, c1985, 3472
38 16 27 6750C Binary Phase Diagram