Enhancing STEM Education: Applications of Regression Analysis in Engineering
This resource explores the transformative role of regression analysis in STEM education, particularly for undergraduate students. It covers both linear and nonlinear regression models, providing practical examples such as stress-strain analysis in composite materials and bone scans. The resource aims to enrich students’ understanding of regression techniques and their applications in real-world scenarios, fostering critical thinking and problem-solving skills. Relevant exercises and data manipulation strategies are included to reinforce learning.

Enhancing STEM Education: Applications of Regression Analysis in Engineering
E N D
Presentation Transcript
Regressionhttp://numericalmethods.eng.usf.eduTransforming Numerical Methods Education for the STEM undergraduate http://numericalmethods.eng.usf.edu Transforming Numerical Methods Education for the STEM Undergraduate
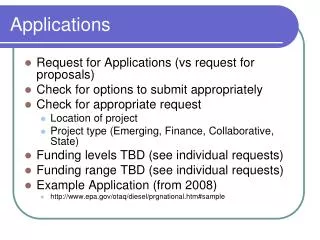
Applications http://numericalmethods.eng.usf.edu Transforming Numerical Methods Education for the STEM Undergraduate
Mousetrap Car http://numericalmethods.eng.usf.edu Transforming Numerical Methods Education for the STEM Undergraduate
Torsional Stiffness of a Mousetrap Spring http://numericalmethods.eng.usf.edu Transforming Numerical Methods Education for the STEM Undergraduate
Stress vs Strain in a Composite Material http://numericalmethods.eng.usf.edu Transforming Numerical Methods Education for the STEM Undergraduate
A Bone Scan http://numericalmethods.eng.usf.edu Transforming Numerical Methods Education for the STEM Undergraduate
Radiation intensity from Technitium-99m http://numericalmethods.eng.usf.edu Transforming Numerical Methods Education for the STEM Undergraduate
Trunnion-Hub Assembly http://numericalmethods.eng.usf.edu Transforming Numerical Methods Education for the STEM Undergraduate
Thermal Expansion Coefficient Changes with Temperature? http://numericalmethods.eng.usf.edu Transforming Numerical Methods Education for the STEM Undergraduate
THE END http://numericalmethods.eng.usf.edu Transforming Numerical Methods Education for the STEM Undergraduate
Pre-Requisite Knowledge http://numericalmethods.eng.usf.edu Transforming Numerical Methods Education for the STEM Undergraduate
This rapper’s name is • Da Brat • Shawntae Harris • Ke$ha • Ashley Tisdale • Rebecca Black http://numericalmethods.eng.usf.edu Transforming Numerical Methods Education for the STEM Undergraduate
Close to half of the scores in a test given to a class are above the • average score • median score • standard deviation • mean score http://numericalmethods.eng.usf.edu Transforming Numerical Methods Education for the STEM Undergraduate
Given y1, y2,……….. yn,the standard deviation is defined as • . • . • . • . http://numericalmethods.eng.usf.edu Transforming Numerical Methods Education for the STEM Undergraduate
THE END http://numericalmethods.eng.usf.edu Transforming Numerical Methods Education for the STEM Undergraduate
Linear Regression http://numericalmethods.eng.usf.edu Transforming Numerical Methods Education for the STEM Undergraduate
Given (x1,y1), (x2,y2),……….. (xn,yn), best fitting data to y=f (x) by least squares requires minimization of • ) • ) • ) • ) http://numericalmethods.eng.usf.edu Transforming Numerical Methods Education for the STEM Undergraduate
The following data • -136 • 400 • 536 is regressed with least squares regression to a straight line to give y=-116+32.6x. The observed value of y at x=20 is http://numericalmethods.eng.usf.edu Transforming Numerical Methods Education for the STEM Undergraduate
The following data • -136 • 400 • 536 is regressed with least squares regression to a straight line to give y=-116+32.6x. The predicted value of y at x=20 is http://numericalmethods.eng.usf.edu Transforming Numerical Methods Education for the STEM Undergraduate
The following data • -136 • 400 • 536 is regressed with least squares regression to a straight line to give y=-116+32.6x. The residual of y at x=20 is http://numericalmethods.eng.usf.edu Transforming Numerical Methods Education for the STEM Undergraduate
THE END http://numericalmethods.eng.usf.edu Transforming Numerical Methods Education for the STEM Undergraduate
Nonlinear Regression http://numericalmethods.eng.usf.edu Transforming Numerical Methods Education for the STEM Undergraduate
When transforming the data to find the constants of the regression model y=aebx to best fit (x1,y1), (x2,y2),……….. (xn,yn), the sum of the square of the residuals that is minimized is http://numericalmethods.eng.usf.edu Transforming Numerical Methods Education for the STEM Undergraduate
When transforming the data for stress-strain curve for concrete in compression, where is the stress and is the strain, the model is rewritten as • ) • ) • ) • ) http://numericalmethods.eng.usf.edu Transforming Numerical Methods Education for the STEM Undergraduate
Adequacy of Linear Regression Models http://numericalmethods.eng.usf.edu Transforming Numerical Methods Education for the STEM Undergraduate
The case where the coefficient of determination for regression of n data pairs to a straight line is one if • none of data points fall exactly on the straight line • the slope of the straight line is zero • all the data points fall on the straight line http://numericalmethods.eng.usf.edu Transforming Numerical Methods Education for the STEM Undergraduate
The case where the coefficient of determination for regression of n data pairs to a general straight line is zero if the straight line model • has zero intercept • has zero slope • has negative slope • has equal value for intercept and the slope http://numericalmethods.eng.usf.edu Transforming Numerical Methods Education for the STEM Undergraduate
The coefficient of determination varies between • -1 and 1 • 0 and 1 • -2 and 2 http://numericalmethods.eng.usf.edu Transforming Numerical Methods Education for the STEM Undergraduate
The correlation coefficient varies between • -1 and 1 • 0 and 1 • -2 and 2 http://numericalmethods.eng.usf.edu Transforming Numerical Methods Education for the STEM Undergraduate
If the coefficient of determination is 0.25, and the straight line regression model is y=2-0.81x, the correlation coefficient is • -0.25 • -0.50 • 0.00 • 0.25 • 0.50 http://numericalmethods.eng.usf.edu Transforming Numerical Methods Education for the STEM Undergraduate
If the coefficient of determination is 0.25, and the straight line regression model is y=2-0.81x, the strength of the correlation is • Very strong • Strong • Moderate • Weak • Very Weak http://numericalmethods.eng.usf.edu Transforming Numerical Methods Education for the STEM Undergraduate
If the coefficient of determination for a regression line is 0.81, then the percentage amount of the original uncertainty in the data explained by the regression model is • 9 • 19 • 81 http://numericalmethods.eng.usf.edu Transforming Numerical Methods Education for the STEM Undergraduate
The percentage of scaled residuals expected to be in the domain [-2,2] for an adequate regression model is • 85 • 90 • 95 • 100 http://numericalmethods.eng.usf.edu Transforming Numerical Methods Education for the STEM Undergraduate
THE END http://numericalmethods.eng.usf.edu Transforming Numerical Methods Education for the STEM Undergraduate
The average of the following numbers is • 4.0 • 7.0 • 7.5 • 10.0 http://numericalmethods.eng.usf.edu Transforming Numerical Methods Education for the STEM Undergraduate
The following data • 27.480 • 28.956 • 32.625 • 40.000 is regressed with least squares regression to y=a1x. The value of a1 most nearly is http://numericalmethods.eng.usf.edu Transforming Numerical Methods Education for the STEM Undergraduate
A scientist finds that regressing y vs x data given below to straight-line y=a0+a1xresults in the coefficient of determination, r2 for the straight-line model to be zero. • -2.444 • 2.000 • 6.889 • 34.00 The missing value for y at x=17 most nearly is http://numericalmethods.eng.usf.edu Transforming Numerical Methods Education for the STEM Undergraduate
A scientist finds that regressing y vs x data given below to straight-line y=a0+a1xresults in the coefficient of determination, r2 for the straight-line model to be one. • -2.444 • 2.000 • 6.889 • 34.00 The missing value for y at x=17 most nearly is http://numericalmethods.eng.usf.edu Transforming Numerical Methods Education for the STEM Undergraduate
The average of 7 numbers is given 12.6. If 6 of the numbers are 5, 7, 9, 12, 17 and 10, the remaining number is • -47.9 • -47.4 • 15.6 • 28.2 http://numericalmethods.eng.usf.edu Transforming Numerical Methods Education for the STEM Undergraduate