Correlation Search in Graph Databases
Explore correlation mining in graph databases, addressing challenges and presenting a scalable solution for searching correlated graphs efficiently. Learn about the problem definition, candidate set generation, heuristic rules, algorithmic approach, and performance evaluation.

Correlation Search in Graph Databases
E N D
Presentation Transcript
Correlation Search in Graph Databases Yiping Ke James Cheng Wilfred Ng Presented By Phani Yarlagadda
Outline • Motivation • Challenges • Problem Definition • Solution • Performance Evaluation • Related Works
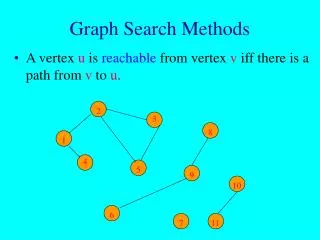
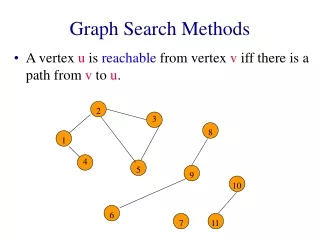
Motivation • Graph Databases and their importance • Correlation mining from graph databases • Structural similarity and statistical similarity
Challenges • Candidate key • High complexity graph operations • Vast search space
Problem Definition • Pearson’s Correlation Coefficient Popularly used correlation measure • Definition Given two graphs g1 and g2, the Pearson’s Correlation Coefficient of g1 and g2, denoted as φ(g1, g2), is defined as follows When supp(g1) or supp(g2) is equal to 0 or 1, φ(g1, g2) is defined to be 0.The range of φ(g1, g2) falls within [−1, 1] In this paper we are concerned about positively correlated graphs only
Problem Definition • Correlated Graphs Two graphs g1 and g2 are correlated if and only if φ(g1, g2) ≥ θ, where θ (0 < θ ≤ 1) is a user-specified minimum correlation threshold.
Problem Definition • Correlated Graph Search Given a graph database D, a correlation query graph q and a minimum correlation threshold θ, the problem of Correlated Graph Search (CGS) is to find the set of all graphs that are correlated with q. The answer set of the CGS problem is defined as Aq = {(g,Dg) : φ(q, g) ≥ θ}.
Solution-Candidate Set Generation • Mine the set of frequent graphs (FG’s) from D using the thresholds • Drawbacks • All existing FG mining algorithms generate graphs with higher support before those with lower support. • Not efficient and scalable ,especially when D is large or the lower bound is low.
Solution-Candidate Set Generation • Mine the set of FG’s using the threshold • Advantages • Efficient candidate generation. • Significant reduction in search space.
Solution-Framework • The framework of the solution consists of the following four steps. • Obtain the projected database Dq of q. • Mine the set of candidate graphs C from Dq, using lower(q,g)/supp(q) as the minimum support threshold. • Refine C by three heuristic rules. • For each candidate graph g C, • Obtain Dg. • Add (g,Dg) to Aq if φ(q, g) ≥ θ.
Solution-Heuristic Rules • Heuristic Rule 1 Given a graph g, if g C and g q, then g base(Aq) Identifies graphs that are guaranteed to be answers
Solution-Heuristic Rules • Heuristic Rule 2 Given two graphs g1 and g2, where g1 g2 and supp(g1, q) = supp(g2, q), if g1 base(Aq), then g2 base(Aq) Helps in reduction of the search space so that the unrewarding query costs for false positives.
Solution-Heuristic Rules • Heuristic Rule 3 Given two graphs g1 and g2, where g1 g2, if supp(g2, q) < f(supp(g1)), then g2 base(Aq) Helps in reduction of the search space so that the unrewarding query costs for false positives.
Solution-Algorithm • Input: A graph database D, a query graph q, and a correlation threshold θ. Output: The answer set Aq. • Obtain Dq; • Mine FGs from Dq using lower(q,g) supp(q) as the minimum support threshold and add the FGs to C; • for each graph g C in size-descending order do • if (g q) • Add (g,Dg) to Aq; • else • Obtain Dg; • if (φ(q, g) ≥ θ) • Add (g,Dg) to Aq; • else • H2 ← {g’ C : g g, supp(g’;Dq) = supp(g;Dq)}; • C ← C−H2; • H3 ← {g’ C : g g, supp(g’;Dq) < f(supp(g))/supp(q) }; • C ← C−H3;
Solution-Example • Consider the graph database below
Solution-Example • Query q • Candidate set
Performance Evaluation • The dataset contains the compound structures of cancer and AIDS data from NCI open database compunds. • The dataset contains about 249k graphs. • On average each graph in dataset has 21 nodes and 23 edges. The number of distinct labels for nodes and edges is 88. • We randomly generate four sets of queries, F1, F2, F3 and F4 each of which contain 100 queries. The support ranges for the queries in F1 to F4 are [0.02,0.05],(0.05,0.07],(0.07,0.1] and (0.1,1.0]
Performance Evaluation • Effect of candidate generation
Performance Evaluation • Effect of
Performance Evaluation • Effect of Heuristic Rules
Performance Evaluation • Effect of Graph Size
Related Works • Raymond proposes an efficient algorithm MCES for similarity search. • Williams proposes an indexing technique that adopts graph decomposition method for similarity search. • Zhang and Feigenbaum adopted φ correlation coefficient to measure the correlated pairs in transaction databases.