Optimizing Firm's Capital Structure: Cost of Capital and Gearing Analysis
This comprehensive guide delves into capital structure theories, exploring the composition of long-term finance, the cost of capital, weighted average cost of capital (WACC), market values, and the impact on a firm's financial risk. Learn how to manage capital structure effectively to reduce WACC and analyze the impact of gearing ratios on financial decisions.


Optimizing Firm's Capital Structure: Cost of Capital and Gearing Analysis
E N D
Presentation Transcript
Capital Structure The composition of long-term finance used by the firm
The Cost of Capital The cost to the firm of raising long-term funds to finance investment projects
Use of the Cost of Capital • The discount rate in NPV calculations • The cut-off rate in IRR calculations • Helps the financial manager to optimise the firm’s capital structure
The weighted average cost of capital The weighted average of the costs of all sources of long-term finance, where each source is weighted by its relative proportion to the firm’s long-run capital structure
Weight by market value or by book value? • Advantages of market value • book value weights ignore changes in market value • cost of capital for ordinary shares, preference shares, and debentures is calculated using market values • Disadvantages of market value • market value weights fluctuate • sometimes more difficult to calculate market value weights
Example A company is financed partly by debt and partly by equity The balance sheet shows the capital structure as follows: Equity (ordinary shares of 100p) £6m Debentures in units of £100 £4m Total £10m
Additional information is as follows: Market price of an equity share 300p Market price of a £100 debenture £95 Cost of equity capital 10% Cost of debt capital 8%
WACC using balance sheet values Value Weight Cost W C Equity £6m 0.6 10% 6.0% Debt £4m 0.4 8% 3.2% WACC 9.2%
WACC using market values Value Weight Cost W C Equity £18m 0.83 10% 8.30% Debt £3.8m 0.17 8% 1.36% WACC 9.66%
Marginal cost of capital • WACC will only remain constant if the firm maintains the same balance of funding • In reality WACC will change as each new source of funding is introduced • If particular funds are being raised for a specific project it might be more appropriate to use the marginal cost of those funds to assess the project rather than using the WACC
The cost of capital and risk As new sources of funds are taken up by a firm the WACC will be affected because the financial risk of the firm will change
Capital structure Can the firm reduce its WACC through managing its capital structure?
Capital structure and risk • Loans and debentures - lowest risk • Preference capital - medium risk • Ordinary shares - highest risk
Capital structure and risk Loans and debentures - lowest risk Debt Preference shares - medium risk Ordinary shares - highest risk Equity
Gearing • A company financed mainly by equity is said to be “low geared” • A company financed mainly by debt is said to be “high geared”
Measuring gearing D G = E D G = D+ E G = Gearing ratio D = Total debt E = Total equity
Gearing ratio can be based upon • Balance sheet values • equity will include reserves • Market values
A plc capital structure Ordinary shares of £1 50,000,000 8% Preference shares of £1 15,000,000 Revaluation reserve 4,000,000 Retained profits 6,000,000 10% loan stock 20,000,000 Total capital employed 95,000,000
Ordinary shares £1.75 Preference shares £0.80 Loan stock £120 per £100 unit Total debt 87,500,000 12,000,000 24,000,000 36,000,000 Market values
Gearing based on balance sheet values 35 G = = 0.55 64 35 G = = 35% 35+ 64
Gearing based on market values 36 G = = 0.41 87.5 36 G = = 29% 36+ 87.5
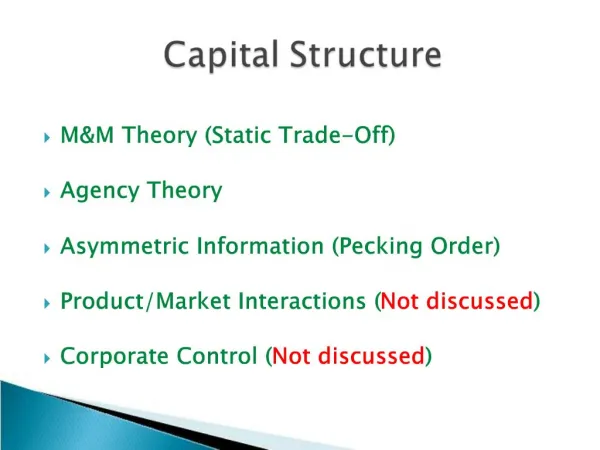
Is there an optimal level of gearing? • The traditional view • yes the firm can minimise its WACC by optimising its mix of debt and equity • The Modigliani and Miller (MM) view • there is no optimal mix of debt and equity and the WACC cannot be influenced by gearing
The traditional view • Debt is less risky and thus cheaper than equity • As the level of gearing increases the cost of debt remains constant up to a certain level and then increases • The cost of equity will increase as the level of gearing increases due to extra risk • WACC will initially fall and then begin to rise as the rising cost of equity (and debt) becomes significant
The traditional view Cost of capital Ke Equity Kw WACC Kd Ko Debt Go Gearing
The MM view • The firm’s cash flows will be discounted at a rate appropriate to the “business risk” of the firm irrespective of the sources of finance • The cost of debt remains constant • As gearing increases the cost of equity will increase but only enough to maintain a constant WACC • The extra earnings on debt will be equal to the return required by the shareholders to compensate for the extra risk
The MM view Cost of capital Ke Equity WACC Kw Debt Kd Gearing
Example B plc C plc Ordinary shares of £1 100,000 60,000 8% loan stock 0 40,000 Net assets 100,000 100,000 Annual earnings 20,000 20,000 Interest paid 0 (3,200) Dividends 20,000 16,800
B plc C plc Market value of ordinary shares £1.48 £2.00 Market value of 8% £100 loan stock £100 Total market value of equity 148,148 120,000 Total market value of debt 40,000 Total market value of company 148,148 160,000 Cost of equity 13.5% 14.0% Cost of debt 8.0% WACC 13.5% 12.5% Gearing ratio based on balance sheet (D/E) 0 0.67
The previous analysis is based upon the traditional view - debt costs less than equity but the cost of equity will increase with gearing due to the increase in risk. The geared company has reduced its WACC because it has taken advantage of cheaper debt
The MM arbitrage argument • Shareholders in C plc would realise that they could earn a greater return by selling their shares in C plc and purchasing shares in B plc • the price of B plc shares would increase • the price of C plc shares would reduce • the market values of the two companies would merge • Shareholders in C plc could borrow to purchase more shares in B plc thus creating their own gearing
An investor holds 1% of the shares in C plc (6 shares) Total market value of the investment £12.00 Total income on the investment at 14% £1.68 Assume that the investor sells the shares in C plc and borrows a further £4.00 The investor can now buy 11 shares in B plc £16.00 The investor’s income at 13.5% will now be £2.16 Interest payments on the loan at 8% will be £0.32 Net income will therefore be £1.84 This gives an increase in income of £0.16 The market value of the investment will be unchanged
MM failings • Taxation ignored • Transaction costs ignored • Is an individual likely to be able to borrow at the same rate as a company?
The revised MM theory • The effects of corporate taxation was included in the analysis • Corporate taxation provides a “tax shield” effect • Due to tax relief on interest the WACC would be reduced and would continue to fall up to gearing of 100%
MM revised to include taxation Cost of capital Ke Equity WACC Kw Debt Kd Gearing