Download
1 / 62
620 likes | 637 Vues
Easily model pipe systems with the Pipe2000 GUI for all campus modeling projects. Create hydraulic models using the UltraEasy GUI for steady and transient modeling.

E N D
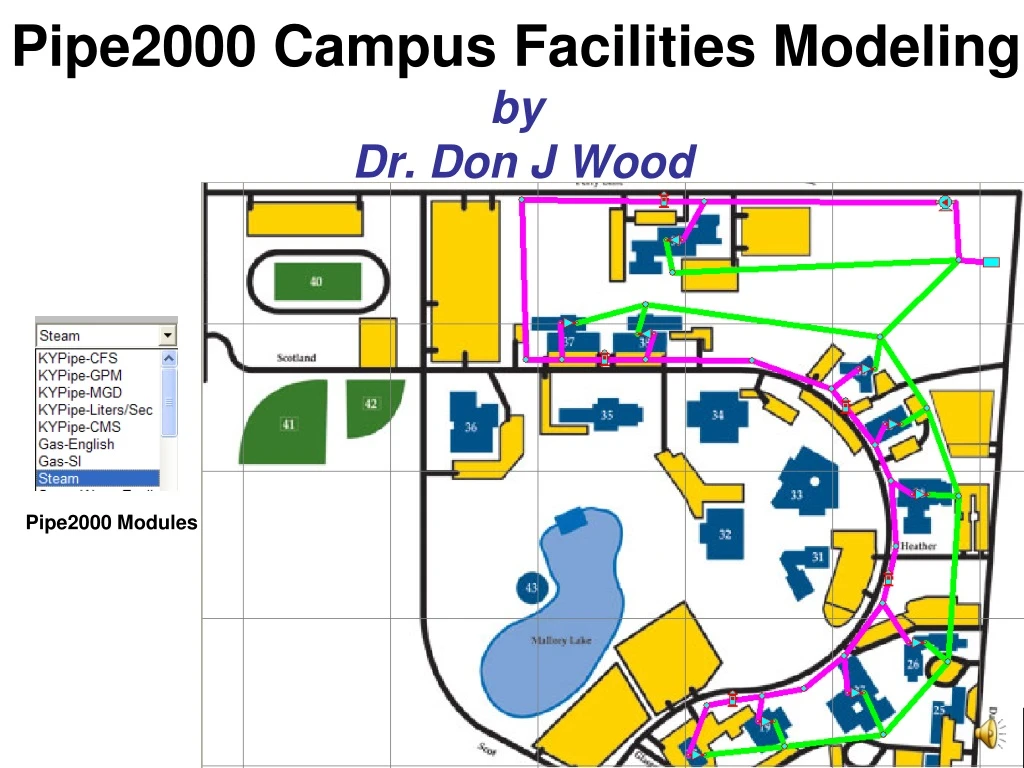
Pipe2000 Campus Facilities Modelingby Dr. Don J Wood Pipe2000 Modules
Pipe2000 GUI • The GUI (Graphical User Interface) determines how efficiently the user can utilize the software. • Pipe2000 GUI only for pipe system modeling • Extremely easy to use • The same for all Campus Modeling projects
Creating a Hydraulic ModelUsing the UltraEasy Pipe2000 GUI(for steady and transient modeling) • Backgrounds • Laying out Pipe Systems • Providing data • Hydraulic Calc. • Labeling your Pipe System
Pipe2000 Backgrounds Subdivision Drawing (DXF)
Pipe2000 Backgrounds Piping Drawing (JPG)
Laying Out Your Pipe SystemAs Easy as 1-2-3 • (1) Left Click (LC) to select existing node (or pipe) • (2) Select first node – move mouse and Right Click (RC) to add Pipe and Node • (3) Select Node and use Dropdown List to change Node Type
Laying Out Your Pipe System Move mouse 1) Move mouse to next location
Laying Out Your Pipe System RC 2) Right Click to add Pipe
Laying Out Your Pipe System Move mouse LC 3) Select new starting node (Left Click)
Laying Out Your Pipe System 4) Move to next location and Right Click
Change Node Types LC LC 1) Select node (LC) and select Type (Pump) from Dropdown List
Change Node Types Node is changed to Pump
Change Node Types Node Type changes complete – Enter Data for each Pipe and Node
Entering Pipe Data Length-- scaled • Select pipe and 2) choose Pipe Type 3) data entered 4) select fittings • Pipe Type button from list automatically from Fittings List One Click and Select Pipe Type can Provide Required Pipe Data
Enter Node Data Pump Data – multiple pumps variable speed pumps Tank Data – fixed diameters various shapes --- max level --- min level
Labels for Data and Results Use Label Menu for other selections Fonts, etc
Pipe2000 Campus Facilities Modeling Examples • Potable Water Distribution & Fire Flows • Chilled Water – supply & return • Hot Water Distribution • Gas Distribution • Steam Distribution saturated superheated
Example Campus Facilities Modeling – Campus Map Use Map as Scaled Background Map For Pipe2000 Models
Potable Water Distribution Model • Supply from City Water System 90 psi static, 75 psi residual @ 2000 gpm • Average Demands for Each Building • Peak Demands for Each Building (GDF=1.4) • Fire Flow at Average Demands • Fire Flow at Peak Demands
Laying out Water Distribution Model LC(4)- RC(2) RC(1) RC(5) Location of City Water Main RC(3) Showing first 5 mouse clicks used to develop Pipe2000 model
Potable Water Distribution Model Demand Locations Fire Hydrant
Chilled Water Model Chillers & Pump Flow Control Valve Sets suction pressure Supply Return Main pipes = 6 in. Buld. Pipes = 4 in. HW C = 140
Modeling Chilled Water System Loads If supply side pressure at the flow control valve is not sufficient the flow control valve will open wide and provide less flow which can be accommodated by the return side Flow Regulators simulate valves which control the flows to buildings Supply side Hydraulics determines the pressure available at the building Return side Hydraulics determines the pressure required at the building to transport water back to pump & chillers
Results – Peak and Average Loads Peak Load Unable to maintain load Average Load
Can We Add a New Building?You can evaluate in 3 minutes New 4 inch Supply Piping New 4 inch Return Piping OK!
Hot Water Distribution System Supply: 450 F @ 200 psi Roughness = 0.3 millifeet Average Building Load = 8 gpm
Pressures at Selected Buildings 8 gpm 14.4 gpm
Pipe2000 Natural Gas Distribution 2 inch pipe 4 inch pipe Pressure Supply (120 psi) Roughness = 0.02 millifeet Average Building Load = 300 MSCF/day
Gas Model Details Load to Building (300 MSCF/day) Pressure Regulator Setting = 40 psi Connection to Gas Main Pressure Supply @ 120 psi Pressure Regulator Setting = 30 psi
Gas Distribution Model Data Gas2000 System Data Pipe2000 Help for Gas Properties
Steam Distribution System Steam Plant 100 psi Roughness = 0.01 millifeet Average Building Load = 400 #/hr
Modeling Steam Distribution • Saturated Steam Analysis 1) plant provides saturated steam @ 100 psi 2) saturated steam is distributed to all buildings 3) Load increases from low (400 #/hr) to high (800 #/hr) • Superheated Steam Analysis 1)plant provides superheated steam @ 100 psi and 450 degrees F 2) heat loss calculated using heat transfer coefficient = 0.15 3) select “Temperature Sensitive Analysis”
Pressures at Selected Buildings 400 #/hr480 560 640 720 800