Download
1 / 48
480 likes | 640 Vues
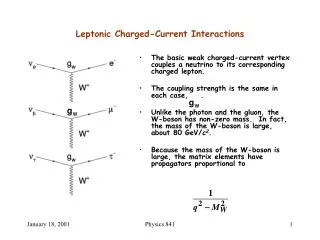
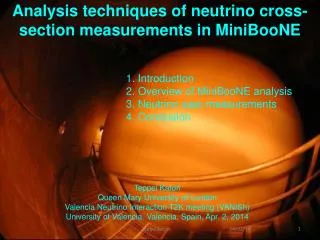
Charged Current Interaction measurements in MiniBooNE. hep-ex/XXX. Teppei Katori for the MiniBooNE collaboration Indiana University NuInt 07, Fermilab, May., 31, 07. Charged Current Interaction measurements in MiniBooNE. hep-ex/XXX.

E N D
Charged Current Interaction measurements in MiniBooNE hep-ex/XXX Teppei Katori for the MiniBooNE collaboration Indiana University NuInt 07, Fermilab, May., 31, 07 Teppei Katori, Indiana University, NuInt '07
Charged Current Interaction measurements in MiniBooNE hep-ex/XXX outline1. CCQE events in MiniBooNE2. Prediction for CCQE events3. CCQE data-MC comparison4. Fit results5. Anti-neutrino CCQE events6. Conclusion Teppei Katori, Indiana University, NuInt '07
1. CCQE events in MiniBooNE Teppei Katori, Indiana University, NuInt '07
1. CCQE events in MiniBooNE nmcharged current quasi-elastic (nmCCQE) interaction is the most abundant (~40%) and the fundamental interaction in MiniBooNE detector MiniBooNE detector (spherical Cherenkov detector) 12C n Teppei Katori, Indiana University, NuInt '07
1. CCQE events in MiniBooNE nmcharged current quasi-elastic (nmCCQE) interaction is the most abundant (~40%) and the fundamental interaction in MiniBooNE detector MiniBooNE detector (spherical Cherenkov detector) muon like Cherenkov light and subsequent decayed electron (Michel electron) like Cherenkov light are the signal of CCQE event Cherenkov 1 e m n-beam 12C Cherenkov 2 n p (Scintillation) Teppei Katori, Indiana University, NuInt '07
1. CCQE events in MiniBooNE nm CCQE interactions (n+n m+p) has characteristic two “subevent” structure from muon decay nm+ n m+ pmnm +`ne + e muon >200 hits 35.0% cut efficiency 197,308 events with 5.58E20POT Michel electron <200 hits Teppei Katori, Indiana University, NuInt '07
1. CCQE events in MiniBooNE Cut and efficiency summary Teppei Katori, Indiana University, NuInt '07
1. CCQE events in MiniBooNE Em m 12C n-beam cosq All kinematics are specified from 2 observables, muon energy Em and muon scattering angle q Energy of the neutrino En and 4-momentum transfer Q2 can be reconstructed by these 2 observables Teppei Katori, Indiana University, NuInt '07
2. Prediction for CCQE events Teppei Katori, Indiana University, NuInt '07
2. Prediction for CCQE events Predicted event rates (NUANCE Monte Carlo) Casper, Nucl.Phys.Proc.Suppl. 112 (2002) 161 Teppei Katori, Indiana University, NuInt '07
2. Prediction for CCQE events Smith and Moniz, Nucl.,Phys.,B43(1972)605 Relativistic Fermi Gas (RFG) Model Carbon is described by the collection of incoherent Fermi gas particles. All details come from hadronic tensor. Teppei Katori, Indiana University, NuInt '07
2. Prediction for CCQE events Smith and Moniz, Nucl.,Phys.,B43(1972)605 Relativistic Fermi Gas (RFG) Model Carbon is described by the collection of incoherent Fermi gas particles. All details come from hadronic tensor. 3 parameters are especially important to control nuclear effect of Carbon; MA = 1.03GeV : axial mass PF = 220MeV : Fermi momentum EB = 34MeV : binding energy Teppei Katori, Indiana University, NuInt '07
3. CCQE data-MC comparison Teppei Katori, Indiana University, NuInt '07
3. CCQE data-MC comparison data-MC ratio from RFG model CCQE kinematics phase space The data-MC agreement is not great Since data-MC disagreements align on the Q2 lines, not En lines, the source of data-MC disagreement is not the neutrino beam prediction, but the neutrino cross section prediction. Teppei Katori, Indiana University, NuInt '07
3. CCQE data-MC comparison data-MC ratio from RFG model CCQE kinematics phase space The data-MC agreement is not great The data-MC disagreement is characterized by 2 features; (1) data deficit at low Q2 region (2) data excess at high Q2 region Teppei Katori, Indiana University, NuInt '07
3. CCQE data-MC comparison Nuclear model parameters are tuned from electron scattering data, thus the best explanations of observed data-MC disagreements are something one cannot measure from the electron scattering data (1) data deficit at low Q2 region Pauli blocking (2) data excess at high Q2 region Axial mass MA We tune the nuclear parameters in RFG model using Q2 distribution; MA = tuned PF = fixed EB = fixed Teppei Katori, Indiana University, NuInt '07
3. CCQE data-MC comparison pz pz py py px px Pauli blocking parameter "kappa" : k To enhance the Pauli blocking at low Q2, we introduced a new parameter k, which is the scale factor of lower bound of nucleon sea and controls the size of nucleon phase space Ehi(fixed) This modification gives significant effect only at low Q2 region Elo(tuned) We tune the nuclear parameters in RFG model using Q2 distribution; MA = tuned PF = fixed EB = fixed k = tuned Teppei Katori, Indiana University, NuInt '07
3. CCQE data-MC comparison Q2 distribution with MA variation Q2 distribution with k variation MA and k are simultaneously fit to the data 2% change of k is sufficient to take account the data deficit at low Q2 region Teppei Katori, Indiana University, NuInt '07
4. Fit results Teppei Katori, Indiana University, NuInt '07
4. Fit results • Least c2 fit for Q2 distribution • c2 = (data - MC)T (Mtotal)-1 (data - MC) c2 minimum is found by global scan of shape only fit with 0.0<Q2(GeV2)<1.0 The total output error matrix keep the correlation of Q2 bins Mtotal = M(p+ production) + M(p- production) + M(K+ production) + M(K0 production) + M(beam model) + M(cross section model) + M(detector model) + M(data statistics) Input error matrices keep the correlation of systematics dependent p+ production (8 parameters) p- production (8 parameters) K+ production (7 parameters) K0 production (9 parameters) beam model (8 parameters) cross section (20 parameters) detector model (39 parameters) independent Teppei Katori, Indiana University, NuInt '07
4. Fit results MA - k fit result MA = 1.23 ± 0.20(stat+sys) k = 1.019 ± 0.011(stat+sys) circle: before fit star: after fit with 1-sigma contour triangle: bkgd shape uncertainty dots : data with error bar dashed line : before fit solid line : after fit dotted line : background dash-dotted :non-CCQElike bkgd Teppei Katori, Indiana University, NuInt '07
4. Fit results Errors The detector model uncertainty dominates the error in MA The error on k is dominated by Q2 shape uncertainty of background events Teppei Katori, Indiana University, NuInt '07
4. Fit results data-MC ratio after the fit MA - k fit result MA = 1.23 ± 0.20(stat+sys) k = 1.019 ± 0.011(stat+sys) Although fit is done in Q2 distribution, entire CCQE kinematics is improved before c2/dof = 79.5/53, P(c2) = 1% i after c2/dof = 45.1/53, P(c2) = 77% Teppei Katori, Indiana University, NuInt '07
4. Fit results MA - k fit result MA = 1.23 ± 0.20(stat+sys) k = 1.019 ± 0.011(stat+sys) data-MC ratio before the fit Although fit is done in Q2 distribution, entire CCQE kinematics is improved before c2/dof = 79.5/53, P(c2) = 1% i after c2/dof = 45.1/53, P(c2) = 77% data-MC ratio after the fit Teppei Katori, Indiana University, NuInt '07
4. Fit results En distribution cosqm distribution Other kinematics distribution also show very good data-MC agreement (This is critical for MiniBooNE neutrino oscillation search experiment) MiniBooNE collaboration, arXiv:0704.1500 [hep-ex] (2007) Teppei Katori, Indiana University, NuInt '07
4. Fit results Q2 distribution MA only fit result MA = 1.25 ± 0.12(stat+sys) fit with fixing k for 0.25<Q2(GeV2)<1.0 good agreement above 0.25GeV2 but gross disagreement at low Q2 region This fit cannot improve entire CCQE phase space Teppei Katori, Indiana University, NuInt '07
4. Fit results MA only fit result MA = 1.25 ± 0.12(stat+sys) data-MC ratio after the fit fit with fixing k for 0.25<Q2(GeV2)<1.0 good agreement above 0.25GeV2 but gross disagreement at low Q2 region This fit cannot improve entire CCQE phase space Teppei Katori, Indiana University, NuInt '07
5. Anti-neutrino CCQE events Teppei Katori, Indiana University, NuInt '07
5. Anti-neutrino CCQE events data with stat error Anti-neutrino Q2 distribution MiniBooNE anti-neutrino CCQE 8772 events (1651 total for pre-MiniBooNE data) We use same cut with neutrino mode The values of MA and k extracted from neutrino mode are employed to anti-neutrino MC, and they describe data Q2 distribution well. Anti-neutrino Q2 distribution Preliminary Teppei Katori, Indiana University, NuInt '07
5. Anti-neutrino CCQE events Anti-neutrino Q2 distribution MiniBooNE anti-neutrino CCQE 8772 events (1651 total for pre-MiniBooNE data) We use same cut with neutrino mode The values of MA and k extracted from neutrino mode are employed to anti-neutrino MC, and they describe data Q2 distribution well. Anti-neutrino Q2 distribution data-MC ratio Preliminary Teppei Katori, Indiana University, NuInt '07
5. Anti-neutrino CCQE events MA = 1.23GeV, k=1.019 data with stat error Anti-neutrino CCQE kinematics MiniBooNE anti-neutrino CCQE 8772 events (1651 total for pre-MiniBooNE data) We use same cut with neutrino mode The values of MA and k extracted from neutrino mode are employed to anti-neutrino MC, and they describe data Q2 distribution well. Anti-neutrino CCQE kinematics variables are described by the MC well, too. `n kinematics Preliminary Teppei Katori, Indiana University, NuInt '07
6. Conclusion MiniBooNE has large CCQE data set around 1GeV region MiniBooNE successfully employee RFG model with appropriate parameter choices for MA and k This new model can describe entire CCQE phase space well The best fit parameters for MiniBooNE CCQE data are; MA = 1.23 ± 0.20(stat+sys) k = 1.019 ± 0.011(stat+sys) Our new model also works well in anti-neutrino data MiniBooNE is currently taking the data with anti-muon neutrino beam Teppei Katori, Indiana University, NuInt '07
MiniBooNE collaboration University of Alabama Los Alamos National Laboratory Bucknell University Louisiana State University University of Cincinnati University of Michigan University of Colorado Princeton University Columbia University Saint Mary’s University of Minnesota Embry Riddle University Virginia Polytechnic Institute Fermi National Accelerator Laboratory Western Illinois University Indiana University Yale University Thank you for your attention! Teppei Katori, Indiana University, NuInt '07
10. Back up Teppei Katori, Indiana University, NuInt '07
4. Fit results MA(GeV2) 0.0 0.1 0.2 0.3 0.4 0.5(GeV2) k 1.50 1.050 1.25 1.025 1.00 1.000 0.0 0.1 0.2 0.3 0.4 0.5(GeV2) 0.6 0.4 c2 probability c2 probability 0.2 0.0 0.0 0.1 0.2 0.3 0.4 0.5(GeV2) Fit result with varying Q2min, Q2min < Q2 < 1.0GeV2 Fit is repeated with changing the Q2min Fit quality (c2 probability) is good even Q2min =0.0GeV2 MA is stable in wide range of Q2min Since k is only important for low Q2 region, it has no power for fit for high Q2 Teppei Katori, Indiana University, NuInt '07
4. Fit results 1.50 MA(GeV2) 1.25 1.00 0.0 0.1 0.2 0.3 0.4 0.5(GeV2) 0.6 c2 probability 0.4 0.2 0.0 0.0 0.1 0.2 0.3 0.4 0.5(GeV2) MA only fit with varying Q2min, Q2min < Q2 < 1.0GeV2 Fit is repeated with changing the Q2min Fit quality (c2 probability) is low for Q2min < 0.2GeV2 MA is stable in wide range of Q2min for Q2min > 0.2GeV2 Teppei Katori, Indiana University, NuInt '07
3. Neutrino beam HARP experiment (CERN) Modeling Production of Secondary Pions - 5% l Beryllium target - 8.9 GeV proton beam momentum Data are fit to a Sanford-Wang parameterization. HARP collaboration, hep-ex/0702024 Teppei Katori, Indiana University, NuInt '07
3. Neutrino beam Modeling Production of Secondary Kaons K+ Data from 10 - 24 GeV. Uses a Feynman Scaling Parameterization. K0 data are also parameterized. In situ measurement of K+ from LMC agrees within errors with parameterization Teppei Katori, Indiana University, NuInt '07
5. Cross section model 25% N N 8% 0 N N Events producing pions CCp+ Easy to tag due to 3 subevents. Not a substantial background to the oscillation analysis. NCp0 Thep0decays to 2 photons, which can look “electron-like” mimicking the signal... <1% ofp0contribute to background. (also decays to a single photon with 0.56% probability) Teppei Katori, Indiana University, NuInt '07
6. Blind analysis “Intrinsic”ne + nesources: • m+e+nm ne (52%) • K+ p0 e+ne (29%) • K0 p e ne (14%) • Other ( 5%) p m nm Km nm Since MiniBooNE is blind analysis experiment, we need to constraint intrinsic ne background without measuring directly (1) m decay ne background (2) K decay ne background m e nm ne Kp e ne ne/nm = 0.5% Antineutrino content: 6% Teppei Katori, Indiana University, NuInt '07
6. Blind analysis CCQE En (GeV) En = 0.43 Ep Ep(GeV) hit time (1) measure nm flux from nmCCQE event to constraint nebackground from m decay nmCCQE is one of the open boxes. Kinematics allows connection topflux, hence intrinsic ne background from m decay is constraint. NC veto hits high energy energy p m nm En-Ep space m e nm ne Teppei Katori, Indiana University, NuInt '07
6. Blind analysis CCQE hit time (2) measure high energy nm events to constraint nebackground from K decay At high energies, above “signal range” nm and “ne -like” events are largely due to kaon decay NC veto hits high energy energy p m nm example of open boxes; - nmCCQE - high energy event - CCp+ - NC elastics - NC po - NC electron scattering - Michel electron etc.... Km nm signal range n events Dominated by Kaon decay Kp e ne Teppei Katori, Indiana University, NuInt '07
7. Error analysis Handling uncertainties in the analyses: What we begin with... ... what we need For a given source of uncertainty, Errors in bins of EnQE and information on the correlations between bins For a given source of uncertainty, Errors on a wide range of parameters in the underlying model "multisim" nonlinear error propagation Input error matrix keep the all correlation of systematics Output error matrix keep the all correlation of EnQE bins Teppei Katori, Indiana University, NuInt '07
7. Multisim Input error matrices dependent p+ production (8 parameters) p- production (8 parameters) K+ production (7 parameters) K0 production (9 parameters) beam model (8 parameters) cross section (20 parameters) detector model (39 parameters) independent Multi-simulation (Multisim) method many fake experiments with different parameter set give the variation of correlated systematic errors for each independent error matrix total error matrix is the sum of all independent error matrix B.P.Roe, Nucl.,Instrum.,Meth,A570(2007)157 Teppei Katori, Indiana University, NuInt '07
7. Multisim 1st cross section model 2nd cross section model 3rd cross section model ... n1 n2 n3 n4 n5 n6 n7 n8 EnQE (GeV) cross section parameter space QE s norm ex) cross section uncertainties MAQE 6% Elosf 2% QE norm 10% correlated MA uncorrelated Elo Input cross section error matrix cross section error for EnQE repeat this exercise many times to create smooth error matrix for EnQE Teppei Katori, Indiana University, NuInt '07
7. Multisim 1st cross section model 2nd cross section model 3rd cross section model ... n1 n2 n3 n4 n5 n6 n7 n8 EnQE (GeV) cross section parameter space QE s norm ex) cross section uncertainties MAQE 6% Elosf 2% QE norm 10% correlated MA uncorrelated Elo Input cross section error matrix cross section error for EnQE repeat this exercise many times to create smooth error matrix for EnQE Teppei Katori, Indiana University, NuInt '07
7. Multisim 1st cross section model 2nd cross section model 3rd cross section model ... n1 n2 n3 n4 n5 n6 n7 n8 EnQE (GeV) Output cross section error matrix for EnQE cross section error for EnQE Oscillation analysis use output error matrix for c2 fit; c2= (data - MC)T (Moutput)-1 (data - MC) Teppei Katori, Indiana University, NuInt '07
7. Multisim ex) cross section uncertainties MAQE 6% Elosf 2% QE norm 10% QE shape function of E e/ QE function of E NC 0 ratefunction of 0 mom MAcoh, coh ±25% Nrate function of mom + 7% BF EB, pF 9 MeV, 30 MeV s 10% MA1 25% MAN 40% DIS 25% etc... determined from MiniBooNE QE data determined from MiniBooNE NC 0 data determined from other experiments Teppei Katori, Indiana University, NuInt '07