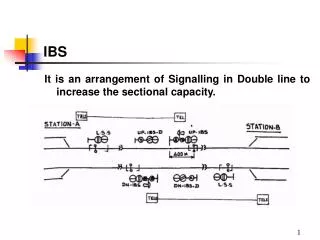
Coverage Solutions IBS
Coverage Solutions IBS. In-Building in the News. Drivers of In-Building Deployments. End-users expect wireless service indoors 40 to 70% calls placed In-Building “X-Files” Effect Capture more traffic Increase ARPU Value Added Services Better network performance High Data Rates

Coverage Solutions IBS
E N D
Presentation Transcript
Drivers of In-Building Deployments • End-users expect wireless service indoors • 40 to 70% calls placed In-Building • “X-Files” Effect • Capture more traffic • Increase ARPU • Value Added Services • Better network performance • High Data Rates • Essential for 3G • Free up macro capacity • New revenue streams • Data services for GPRS/EDGE and CDMA/WCDMA
Obstacles of In-Building Deployments (Carrier Perspective) • Calculating Cost/Benefit • Bucket of voice and data minutes • “New adds” drives business case • Who pays? • Coverage • Some coverage from outdoor system • Control • Exclusive access • Customers want lower communication costs (like landline pricing) but also want a equal access system (neutral host)
Why are In-Building Solutions so Important? (Industry View) While in-building coverage has played a far more limited role in this drive to improve service quality in years past, the increased emphasis on data services in next generation networks, as well as renewed focus on the lucrative enterprise market, is forcing wireless carriers to reassess this market. Signals Ahead , April, 2005 According to a study of 16,800 wireless users released in July 2003 by J.D. Power and Associates, 40 percent of wireless calls are placed indoors. Of these, 48 percent are conducted at home, 21 percent at work and 31 percent inside other structures , such as a shopping mall. The same study finds that the dropped or disconnected calls are the biggest bugbear for 32 percent of users, with static or interference a close second with 29 percent nuisance rating. ABI Research, In-Building Wireless Systems 2004 Unstrung Insider, February 2004
Traffic per cell (Erlang) Significant new traffic In WCDMA: In GSM: Power is Capacity !!! Capacity is power independent Experience shows that an investment in Ericsson In-building Solutions usually pays for itself within 12 to 24 months. For a wireless office solution, the payback time can be as short as a few months In-Building cell traffic • Coverage/capacity inter-dependent in the downlink • Indoor users consume more of the resources* • Coverage depend on RF power, sensitivity and C/I • Capacity determined by number of channels used Macro cell traffic Time Launch of in-building cell Why are In-Building Solutions so Important? (Ericsson’s View) In a UMTS network…the addition of in-building systems has the potential to increase network capacity up to 400 percent. Moreover, cost per subscriber, including the cost of the in-building system, can be reduced 67%
UMTS Case Study First Quarter Report April 2004
Typical Macro Coverage Layer • Each Operator has their own antenna systems at or above rooftop level • Good outdoor and in-vehicle coverage • Coverage into building not guaranteed • Macro sites difficult to acquire in historic centers or in environmentally sensitive areas • Minimum one base station per site • Typical cell range : 1 – 10 km (0.6 to 6 miles)
99,5% 45x45m 92% 83% 69% 60x120m Indoor coverage probability from macro networkHSDPA (5 codes+16QAM)Site to site: 800m Pr { DL>1 Mbps/sub }Low load Pr { DL>384 kbps/sub }Low load
99,5% 45x45m 92% 85% 93% 60x120m Indoor coverage probability from macro networkHSDPA (5 codes+16QAM)Site to site: 800m Pr { DL>384 kbps/sub }High load Pr { DL>384 kbps/sub }Low load
Indoor WCDMA coverage macro networkSummary • Even with site-to-site distances of 800m in the macro network, WCDMA uplink coverage will not be complete in larger buildings • Even at low loads and close site-to-site distances, it will be difficult to guarantee good coverage for high bit-rate services (> 1 Mbps) on the downlink, especially in larger buildings • At high loads, it will be difficult to guarantee good coverage even at moderate bit-rates (> 384 kbps), especially in larger buildings.
In-Building Market First Quarter Report April 2004
Target In-Building Venues • Most In-Building Installations target the following venues: • Airports and Subways • Shopping Malls • Hospitals • Enterprises • Can be Single Operator or Multi-Carrier Systems • Owner participationship varies (case by case) • Many venues require a converged system (Cellular Voice and 802.x technology)
Active DAS Fiber cable RBS Level 3 REMOTE UNIT Level 2 TX/R Level 1 Level 0 In-Building Solution Types Passive DAS
No power supply required Can cover up to large buildings Excellent reliability No integrated alarm and supervision Capacity independent (RF power provided by RBS/Repeater) Full band In-Building Solution Types Active DAS Passive DAS • Active components • Power supply required • Integrated alarm and supervision function • Band limited • Ideal for large buildings or campuses • Coverage dependent on capacity • Can be used with low power RF source • Flexible to expand coverage
In-Building Solutions –Supplier Landscape Products Services Mars Kathrein MacTech LCC InnerWireless LGC Wireless Northstar Andrew InCode BCI ADC EMS Goodman WFI Mobile Access Powerwave Base Station/Repeaters Product and Service Vendors Nokia InnerWireless Andrew Lucent Siemens ip.access RadioFrame JCI Spotwave Nortel First Quarter Report April 2004
Current and Projected Deployment Costs Source: ABI Research, In-Building Wireless Systems 2004
Current and Projected Deployments Source: ABI Research, In-Building Wireless Systems 2004
Product Portfolio Overview First Quarter Report April 2004
Ericsson IBS Philosophy • Every building is unique • A broad and flexible portfolio gives most cost effective solution • From a mobile network perspective, the in-building site is just another site • One product or solution does not fit all building types
Solution Offering Overview • Antenna Systems- Passive coaxial - Fiber optical- Radiating cable- Hybrid Solution • Radio Base Stations - IP Backhaul Transmission - main/Remote Units • WLAN and DAS integration • Multi-Operator combining box • Enterprise solutions- Network based- PBX based • A complete service portfolio • Training
Passive Coaxial Cable DAS Solution 0 Splitters/Tappers Antennas RBS/BDA Coaxial cables Combining Box The RF signal from the base station/BDA is distributed throughout thesystem
Passive Distributed Antenna System • Supports all wireless bands from 800 MHz to 2500 MHz • Excellent reliability • Cost efficient • 380 MHz support in roadmap • Public safety • Supports up to large buildings
Active Fiber Cable DAS Solution Remote Unit Fiber Remote Unit Passive system Master Unit Local Interface RBS/BDA RF signals from the RBS/BDA are converted to an optical signal and transported to the Remote Units. The Remote Unit converts the signal back to RF that are distributed via a small coaxial system.
Fiber Optic Distributed Antenna System • Available for all cellular bands from 800 MHz to 2500 MHz • Single-, Dual- and Triple-band versions • Varying output power for optimized performance/cost • Interconnect link for remote local interface • Combines with passive distribution • Outdoor versions
Business Case Considerations First Quarter Report April 2004
25 20 15 Erlang 10 5 0 Time Example of In-Building Solution Impact Shopping mall (I) New traffic portion: 78% • Building characteristics • 4-storey buildingSystem characteristics • 35 antennas • RBS 2202 • Areas covered: • Basement car park • Ground floor • 1st to 3rd floor Total traffic Indoor cell Macro cells
Example Traffic and Revenue • For Operator’s using fixed tariffing (”bucket of minutes”), increased traffic is not a business concern unless • There is substantial roaming traffic (national/international) • Most Revenuecalculations based on ”New Adds” but should also include Value Added Services Impact, Churn and Performance improvements
Example CAPEX and OPEX Many different financial arrangements can be used to lower or spread-out the initial and on-going costs incurred
Example Return of Investment Based on a long MTBF rate (min of 20 years), most installed DAS systems will provide reliable service well beyond the initial investment period. Furthermore, since DAS systems are technology transparency, little or no cost is required to upgrade for new technologies
Solution Portfolio Overview First Quarter Report April 2004
In-Building Services portfolio • Project Management • RF design • Implementation engineering • Installation • Integration and verification • Acceptance testing • Optimization • Operation and maintenance • Business Consulting • Customized services • Engineering documentation • Training
In-Building Implementation Process 1. Input Data 5. Implementation 7. Acceptance Test 6. Integration and Commissioning 2. Preliminary Design 3. Site survey and test measurements 4. Design proposal
In-Building Tools First Quarter Report April 2004
IBS Tools Ericsson IBS tools help delivery projects efficiently with high quality TEMS Pocket TEMS Transmitter TEMS Light TEMS Pocket TEMS Pocket TEMS Transmitter Case TEMS Transmitter TEMS Light
In-Building Reference Project First Quarter Report April 2004
Taipei Financial Center, Taiwan • World Tallest Building (508m/1667ft) • 101 floors above ground, 5 below ground • Shopping area from B1 to 6 floor open to public in November 2003 • Tower block from 7 floor to 90 floor mainly offices for banking and trading • Observatory point at 101 floor, open to public on 1st January 2005 • All floors to be in operation by Mid 2005 • World fastest lifts, 1008m/3307ft per minute World tallest building
Solution overview • Total of 8 Cells - 4 passive - 4 active • Passive solution - Ericsson Tripleband combining box - A Bandpass filter for each GSM900 RBS preventing interference from the CDMA800 Tx. - A 10 MHz guardband between the CDMA800 and the GSM900 • Active solution -CDMA 800/GSM900/ GSM1800/ WCDMA • Lift coverage - Remote units installed above the lift car
Taipei Financial Center in numbers • Coverage area 4 Million ft2 • Total coaxial cable length: 164,040 ft • Total optical fiber cable: 65,616 ft (using Ericsson Ribbonet solution) • Number of omni-directional antenna: 800 • Number of directional antenna: 400 • Tripleband Remote Units: 184 • CDMA800 Remote Units: 123