Mastering Computational Skills Through Engaging Scratch Projects and Data Analysis
10 likes | 151 Vues
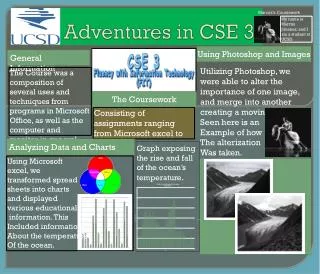
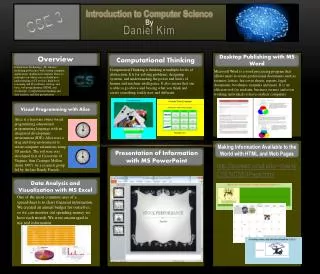
This project highlights the computational skills acquired through three engaging Scratch projects, including the challenging creation of a Tic Tac Toe game. Key learning outcomes included the use of conditional statements and data organization methods, such as building calendars. Additionally, we explored web development fundamentals with Notepad++ and Photoshop to design a homepage. We learned about data integrity and manipulation through statistics, specifically analyzing misleading data trends. Lastly, we gained proficiency in data analysis and graphing using Microsoft Excel.

Mastering Computational Skills Through Engaging Scratch Projects and Data Analysis
E N D
Presentation Transcript
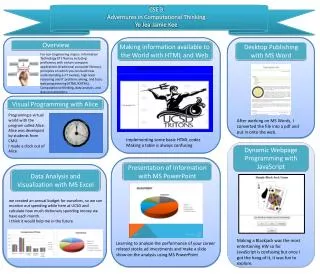
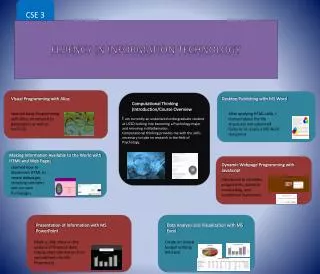
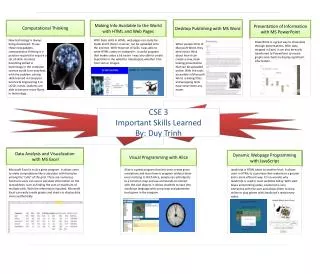
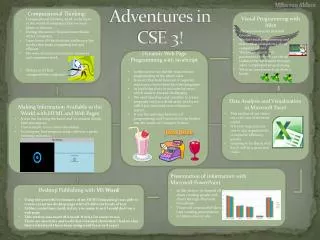
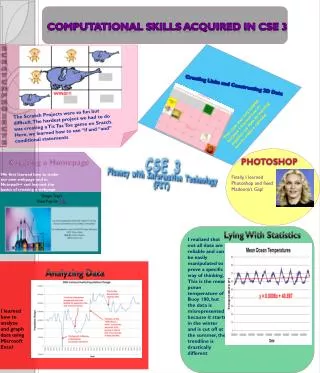
Computational Skills Acquired in CSE 3 SCRATCH PROJECTS Creating Links and Constructing 2D Data The Scratch Projects were so fun but difficult. The hardest project we had to do was creating a Tic Tac Toe game on Sratch. Here, we learned how to use “if and “and” conditional statements This class was very helpful, because I learned how to organize my data by learning how to make a calendar PHOTOSHOP Creating a Homepage We first learned how to make our own webpage and in Notepad++ and learned the basics of creating a webpage. Finally, I learned Photoshop and fixed Madonna’s Gap! Lying With Statistics I realized that not all data are reliable and can be easily manipulated to prove a specific way of thinking. This is the mean pcean temperature of Buoy 100, but the data is misrepresented because it starts in the winter and is cut off at the summer, the trendline is drastically different Analyzing Data I learned how to analyze and graph data using Microsoft Excel