Visualization Methods for Molecular Studies on the Web Platform
170 likes | 325 Vues
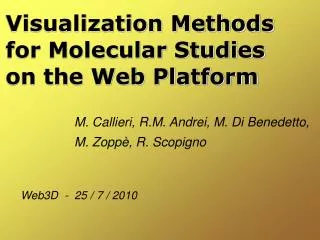
Visualization Methods for Molecular Studies on the Web Platform. Web3D - 25 / 7 / 2010. M. Callieri, R.M. Andrei, M. Di Benedetto, M. Zoppè, R. Scopigno. ----- Who / Where / Why ?. Marco Callieri, PhD in Computer Science, work on 3D Computer Graphics

Visualization Methods for Molecular Studies on the Web Platform
E N D
Presentation Transcript
Visualization Methods for Molecular Studies on the Web Platform Web3D - 25 / 7 / 2010 M. Callieri, R.M. Andrei, M. Di Benedetto, M. Zoppè, R. Scopigno
----- Who / Where / Why ? Marco Callieri, PhD in Computer Science, work on 3D Computer Graphics Joint work of two research groups of the CNR(the Italian National Research Council) in Pisa Visual Computing Lab Institute of Science and Technologies of Information - 3D Computer Graphics, computational geometry - 3D scanning, realworld data acquisition and management - Large dataset management, Multiresolution, data structures - Scientific Visualization SCIVIS unit Institute of Clinical Physiology (IFC) - Visualization of the processes of Molecular Biology - CG movies of inner cellular phenomena - Protein motion calculation and visualization - Tool for the management of protein data inside CG software
+---- Background Molecular Biology studies often rely on the visualization of measured/simulated/inferred data... Different levels of description of the molecular structure + space-varying physico-chemical properties + superimposition of many information layers + various transfer functions Why advanced visualization? > Study: evaluate scientific data in the research world... > Presentation: browse the content of data repositories... > Divulgation: present scientific data to the large public... The web is the perfect platform for these purposes...
-+--- Out there... Some tools does exist (proprietary and free) for the Web-based publication of molecular data... Plugin-based like Chime or Java-based like JMol... Beside problems of maintenance, platform compatibility, performances, almost all of the existing tools use: - Scene-graph paradygm - Fixed rendering/style modes This make these tools easier to be used (for biologist) but not really flexible...
++--- Rendering What about the graphics used ? ...a blast from the '80 This is due to limited resources, scarce HW mapping and lack of computational power... Something more advanced is needed... It is not just a matter of "looking good", a more complex/accurate/rich shading is a better way to convey information and make things much more understandable
--+-- Our Idea By exploiting the potentiality, flexibility and HW binding of WebGL, the higher level structure and easy-to-use programming interface of SpiderGL, plus the intrinsic expressive power of JavaScript... It is possible to use the biological data in order to create Arbitrary Interactive Advancedweb-basedvisualization scheme Using all the available techniques of computer graphics, striving toward visual quality, and using HW Any data you like, any combination of data you like, multiple layers of information, any rendering style you want User may change viewpoint, arrange things around, user may play with rendering parameters
+-+-- WebGL A "soon to be" standard for the inclusion of a 3D graphics API in the HTML5 canvas Based on OpenGL|ES and manged by the Khronos group. We do like it because: - No Plugin / full HW support, integrated in browsers - Completely customizable rendering pipeline - Shader-based, may exploit all CG tricks for better rendering Problem (but jus for now): not yet fixed as a standard Problem: too low level to be effectively used
-++-- SpiderGL A support library, designed to ease the use of WebGL... > Simplify the creation of visualization applications by automating the more tedious / repetitive tasks in the data management, scene setup and rendering. > Provides higher level objects and data structures which help the creation of complex visualization applications > Implements an event-based paradigm quite smple to use but really flexible. A full description of SpiderGL this afternoon, in the session "Papers 7: web integration"
+++-- As an Example Bring to the Web platform a specific visualization scheme designed by the SCIVIS unit to be used in the "Protein Expressions" CG movies. The idea of this visualization scheme is to use shading and rendering effects to exploit perceptual associations between the values to be mapped and visual characterization of real-world objects. This visualization deals with two important protein properties, data comes from biology data repositories and physico-chemical tools.
---+- Visualization Scheme - Lipophilicity: how easily the molecular surface bonds with fat (the opposite is hydrophiliciy, the ability to bond with water). This property has effect on the surface, the more lipophilic areas are rendered white, shiny, smooth porcelain-like (water does not stick to porcelain, but fat does) while hydrophilic areas are rendered dark, rough and dull cookie-like (water can soak cookies) - Electrostatic Potential: each atom has a charge, the combined charges builds an electric field around the molecule. Effect of this property takes place in the volume around the molecule. Field lines are a common way to represent this kind of data; in this case we calculated some "significant" field lines and rendered them as particles flowing according to polarity
+--+- First implementation - No surface motion, single configuration (too much data to transfer, still an open issue) - 3D model of the protein generated from PyMol (biology software) imported as an OBJ mesh using SpiderGL - Surface appearance uses texture based effects for diffuse color + bump map + specularity map. These are standard shading techniques, easily implemented in GLSL shaders - Lines for Electrostatic Field calculated in an external tool and saved in JSON format as polylines. The JSON file is parsed and the lines are rendered with a shader-based "animated dashed line" effect
-+-+- As we wanted The style used in the movie has been replicated... (and some neat effects have also been added) However... we used CG-like data and not (as advertised), the original scientific data...
++-+- Molecular Biology data 1> Use JavaScript to parse the biological file formats... In most cases it's easy, since thay are ASCII formats. 2> Use JavaScript to manipulate the read data as needed 3> use SpiderGL/WebGL to render the data... In the examples, I implemented a PDB(molecular description at atomic level) and DX(volumetric data) reader with no major effort Moreover, XML output is possible on some biological tools Other tools have a scripting language which can be used to export custom data formats...
--++- Molecular Biology data - Geometry of the atomic structure has been generated from the PDB file, more complex structure (Helix, B-sheets) are easy to be procedurally generated. - Lipophilic info loaded from DX file, mapped on surface and rendered using simple transfer function. - Volumetric info loaded and visualized, a more "volumetric" visualization would be better (but there is no 3D-texture support !!!). - Lines calculation in JavaScript: certainly possible, surely interesting, but not yet implemented. CAVEAT: for some data, preprocessing will always be preferable (for both computational and space optimization). A GPU-friendly management may resolve the speed problem, but NOT the data transfer problem
+-++- Yes, indeed This is more difficult than using scene-graph based tools However: - the results are really encouraging, it has been possible to do all that was on our whishlist - peculiar data require peculiar visualization, often outside the scope of general-purpose tools - the use of Javascript libraries like SpiderGL are in the reach of even non-programmers
-+++- Future Work GOAL 1 -- Build a complete support library for the creation of web-based visualization schemems for the molecular biology. This will require - importers library: functions to parse the most common data formats used by biology tools - data processing: general purpose data structures and the typical matemathical and statistical functions used in visualization - shaders library: examples to help build quicky visualization apps and give a starting point for developers GOAL 2 -- An effective and scientifically correct way to display molecular surface for protein motion. Too complex topology changes to use a mesh (and, anyway, too much data to transfer), it will probably be necessary to do it fully on the GPU
Thanks for your attention…QuestionTime ?? ! ! ? ??? ! callieri@isti.cnr.it http://vcg.isti.cnr.it http://www.scivis.ifc.cnr.it/