Comprehensive Analysis and Graphing of Functions
This guide provides a thorough understanding of how to analyze and sketch the graph of a function using analytical techniques. Key aspects include determining x-intercepts, y-intercepts, and identifying symmetry, continuity, domain, and range. The analysis also covers vertical and horizontal asymptotes, differentiability, extrema, concavity, and points of inflection. Specific examples illustrate these concepts, including the identification of critical points, increasing and decreasing intervals, and asymptotic behavior. Equip yourself with the tools to accurately analyze and graph any function.

Comprehensive Analysis and Graphing of Functions
E N D
Presentation Transcript
Section 3.6 Analysis of a Function
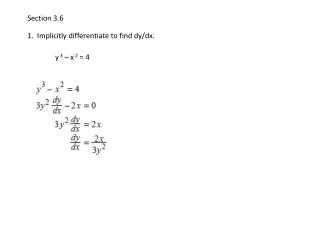
Objective: To be able to sketch the graph of a function based on an analytical approach. • x-intercepts: set and find x-values. • y-intercepts: find • Symmetry: y-axis → origin → • Continuity: intervals where • Domain: all values of x that have functional values. • Range: switch x and y, resolve for y, then repeat #5.
7. Vertical Asymptotes: • Differentiability: all values of x where the derivative is defined. • Extrema: endpoints. • Concavity: • Points of Inflection: • Horizontal Asymptotes: • Period (of a trig function): normal periods are 2π for sin, cos, csc, sec and π for tan, and cot. It changes when a number is in front of the variable – divide period by #. • Slant Asymptote: when degree of numerator is one more than degree of denominator.
Analyze and sketch the graph. 1. _ _ + + 2 -2 0 Rel min @ (0, 4.5) No rel max
_ _ + 2 -2 No infl. pts b/c f(-2) and f(2) are undefined.
Domain: (-∞, -2), (-2, 2), (2, ∞) Vertical Asymptote: x = 2, x = -2 Horizontal Asymptote: y = 2 Symmetry: y-axis symmetry x-intercepts: (-3, 0), (3, 0) y-intercept: (0, 4.5) Intervals: (-∞, -2) → decr, cd (-2, 0) → decr, cu (0, 2) → incr, cu (2, ∞) → incr, cd
Analyze and sketch the graph. 2. _ No relative extrema
_ + Infl. Pt. @
Domain: Vertical Asymptote: Horizontal Asymptote: none Symmetry: none x-intercepts: y-intercept: (0, 1) Intervals: → decr, cu → decr, cd