Download

1 / 63
630 likes | 856 Vues
Jonathan Bradshaw. Research on child poverty and child well-being. Centre for Social Policy Dartington 14 April 2008. Outline:. Tour of my research on the subject over the last decade or so It has moved from UK research on child income poverty

E N D
Jonathan Bradshaw Research on child poverty and child well-being Centre for Social Policy Dartington 14 April 2008
Outline: • Tour of my research on the subject over the last decade or so • It has moved from • UK research on child income poverty • To comparative research on child income poverty • To UK research on overlaps - more than one indicator • To comparative research on overlaps • To UK research on child wellbeing and spatial • To comparative research on child well-being
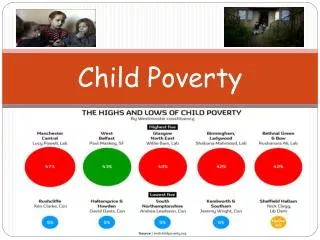
Child poverty:1979-1995/660 per cent equivalent household income
Euro-mean Child poverty rates 199560% of the national equivalised median income.
End of child poverty • Prime Minister’s pledge: “Our historic aim, that ours is the first generation to end child poverty forever….It’s a 20 year mission but I believe it can be done”
poverty line Tax benefit model table situation after April 2008
Comparative background: • The child has been absent from EU – lack of “competence” under Treaties • Lisbon summit introduces social inclusion – and enables the child to come in • Social inclusion strategy monitored by “Laeken” indicators – only two on children • % children living in workless families • Relative child poverty rates
% children 0-17 living in workless households 2006. (Eurostat 2007)
Child poverty rate (less than 60 per cent of the median 2005 (Eurostat)
What is wrong with income poverty? • Income • Is not easy to measure • Is not a good measure of command over resources – ignores dissaving, borrowing and domestic consumption • Relative thresholds very different in different countries
What is wrong with income poverty? • Income not easy to measure • Not a good measure of command over resources • Relative threshold very different in different countries • 60 per cent of median arbitrary • Modified OECD equivalence scale has no basis in science • Poverty rates hide poverty gaps and poverty persistence
Overlaps analysis • Began in Ireland • Now in FRS • Coming in EU SILC • More reliable and probably more severe • Have used it in • MCS • BHPS • SASAS • Bulgaria • Georgia
Monitoring child well-being in the UK • Poverty the outcomesfor children (FPSC 2001) • Child well-being in the UK, Save the Children (2002) • Child well-being in the UK, Save the Children (2005)
Every Child Matters: Outcomes framework • Economic well-being: having sufficient income and material comfort to be able to take advantage of opportunities. • Being healthy: enjoying good physical and mental health and living a healthy lifestyle. • Staying safe: being protected from harm and neglect and growing up able to look after themselves. • Enjoying and achieving: getting the most out of life and developing broad skills for adulthood. • Making a positive contribution: developing the skills and attitudes to contribute to the society in which they live. • Input orientated – not operationalised
Child demography Child poverty and deprivation Child health Child lifestyles Mental health and well-being Child’s time and space Child maltreatment In and leaving care Childcare Crime and illegal drug use Education Housing and neighbourhoods Chapters
Broad conclusions • Some things getting better • Relative child income poverty (until this year) • Attainment • Child accidental deaths • Housing conditions • Some things steady • Teenage conceptions • Persistent child poverty • NEET • Low birth weight • Some things getting worse • Obesity • Class differentials in infant mortality • Looked after children • Sexual health
Material deprivation(lone parents) 1999 2003 Proportion unable to afford selected items 8 2 Cooked main meal every day 9 5 Weatherproof coat for each child 24 10 Toys and sports gear for children 25 10 Two pairs all weather shoes for each child 74 55 One week holiday, not with relatives Financial stress 27 18 Always run out of money before end of week 35 18 Not managing financially Worried about money almost all the time 45 27 2005: H. Sutherland: Can Child Poverty be Abolished? Promises and Policies in the UK, ASPC Sydney 20th July 2005,
Comparative endeavours: • At Luxembourg Presidency of EU: Atkinson Report recommends “child mainstreaming” and development of child well-being indicators • EUROSTAT cautious and reluctant • Suggestion that one extra indicator on educational attainment might be added to Laeken set • So for UK Presidency we develop of an index of child well-being based on existing comparative data sources • (Bradshaw, J., Hoelscher, P. and Richardson, D. (2007) An index of child well-being in the European Union 25, Journal of Social Indicators Research, 80, 133-177.) • Later produce others for • OECD for UNICEF • CEE/CIS for UNICEF
Conceptualisation of child well-being • Multi-dimensional approach • Based on children’s rights as outlined in the UN CRC • Ideology • Child the unit of analysis • What children think and feel is important • Well-being more important than well-becoming • Outcomes rather than inputs • Direct measures rather than indirect measures
Data Sources I: Surveys • Health Behaviour of School Aged Children (HBSC) 36 countries at 2001 • Programme for International Student Assessment (PISA) 32 countries at 2000, 41 at 2003 • Citizenship and Education Survey (CIVED) 28 countries at 1999 and EUYOUPART (2005) • European School Survey Project on Alcohol and other Drugs (ESPAD) 26 countries at 2003 • European Quality of Life Survey (EQLS) 28 countries at 2003
Data Sources II: Series • WHO mortality data base 1993-1999, all countries except DK & CY • World Bank World Development Indicators 2003, all countries • OECD (2004) Education at a Glance, 2002 data • Eurostat (2003) Population and Social Conditions • Eurostat (2004) Labour Force Survey • World Bank (2002) Health, Nutrition and Population Data
Material situation • Relative child income poverty • Child poverty rate • Child poverty gaps • Child deprivation • Lacking car, own bedroom, holidays last year, a computer • Lacking a desk, quiet for study, a computer, calculator, dictionary, text books • Less than ten books in the home • Parental worklessness
Subjective Well-being • Personal well-being • Young people with scores above the middle of a life satisfaction scale 11, 13 and 15 years (%) - HBSC 2001/02 • Students who agree or strongly agree to 'I feel like an outsider (or left out of things)', 15 years (%) - PISA 2003 • Students who agree or strongly agree to 'I feel awkward and out of place', 15 years (%) - PISA 2003 • Students who agree or strongly agree to 'I feel lonely', 15 years (%) - PISA 2003 • Well-being at school • Young people feeling pressured by schoolwork 11, 13 and 15 years (%) - HBSC 2001/02 • Young people liking school a lot 11, 13 and 15 years (%) - HBSC 2001/02 • Self defined health • Young people rating their health as fair or poor 11, 13 and 15 years (%) - HBSC 2001/02
Children’s relationships • Quality of family relations • Students whose parents eat the main meal with them around a table several times a week, 15 years (%) - PISA 2000 • Students whose parents spend time just talking to them several times a week, 15 years (%) - PISA 2000 • Family structure • Young people living in 'single parent' family structures 11, 13 and 15 years (%) - HBSC 2001/02 • Young people living in 'Stepfamily' family structures 11, 13 and 15 years (%) - HBSC 2001/02 • Peer relationships • Young people finding their peers kind and helpful 11, 13 and 15 years (%) - HBSC 2001/02
Overall child well-being and % of young people saying they lived in a lone parent or step parent family r=0.13(ns)
Health • Health at birth • Infant mortality rates (WDI 2003) • Low birth weight (OECD Health Data) • Immunisation • Measles WDI (2003) • DPT3 WDI HNP (2002) • Pol3 WDI HNP (2002) • Health behaviour • Brushing teeth (HBSC) • Eating fruit every day (HBSC) • Eating breakfast before school (HBSC) • Physical activity (HBSC) • Obesity and pre obesity (HBSC)
Risk and Safety • Risk & Safety • Young people who were involved in physical fighting at least once in the previous 12 months 11, 13 and 15 years (%) - HBSC 2001/02 • Young people who were bullied at least once in the previous couple of months 11, 13 and 15 years (%) - HBSC 2001/02 • Child deaths • All child deaths: All under 19 deaths per 100,000 children, WHO mortality database, 3 year averages, MRD • Risk behaviour • Teenage pregnancy (adolescent fertility rate), adolescent fertility rate, births per 1000 women 15-19 - WDI, 2003. • Young people who have had sexual intercourse, 15 years (%) - HBSC 2001/02 • Young people who used a condom during their last sexual intercourse, 15-year-olds (%) - HBSC 2001/02 • Cigarette smoking: Lifetime use 40 times or more 16 years (%) - ESPAD, 2003 • Drunkenness: Lifetime 20 times or more 16 years (%) - ESPAD, 2003 • Cannabis: Experience of use in Lifetime 16 years (%) - ESPAD, 2003 • Inhalants: Experience of use in Lifetime 16 years (%) - ESPAD, 2003
Education • Achievement • Reading literacy achievement, 15 years - PISA, 2003 • Mathematics literacy achievement, 15 years - PISA, 2003 • Science literacy achievement, 15 years - PISA, 2003 • Participation • Full-time and part-time students in public and private institutions, by age: 15-19 as a percentage of the population of 15 to 19-year-olds (2003) LU SK (2002) • Early Years Participation - children in registered childcare (% of children aged 0-2) - OECD, MRD • Aspirations • Percentage of the youth population not in education, not in the labour force or unemployed - age 15-19 - OECD, 2003 • Proportion of pupils aspiring to low skill work, 15 years - PISA, 2000
Child well-being and educational attainment r = 0.39 (ns)
Civic and political participation • Civic participation • Participation rates: young people reporting involvement in two of five social participations 14 years (%) (Eng for UK, French BE) - CivEd. 1999 • Interest in politics • Political interest: young people reporting above the median involvement in political behaviours 14 years (%) (Eng for UK, French BE) - CivEd. 1999
Housing and environment • Overcrowding • Rooms per person in households with children (under 16’s) - EQLS, 2003 • Environment • Households with children who think it is unsafe or very unsafe to walk around in their area at night (under 16’s) - EQLS, 2003 • Households with children reporting many physical environment problems (under 16’s) - EQLS, 2003 • Housing problems • Households with children reporting at least two household problems (under 16’s) - EQLS, 2003
Search for a summary measure • Material well-being is better than child poverty • Different domains have varying relationship to child well-being
Search for a summary measure • Material well-being is better than child poverty • Different domains have varying relationship to child well-being • What about single indicators?
Child well-being and teenage fertility rate R = 0.88***
Search for a summary measure • Material well-being is better than child poverty • Different domains have varying relationship to child well-being • What about single indicators? • What about selected indicators representing domains
Single indicators with highest correlation with cluster score