Download
1 / 39
410 likes | 997 Vues
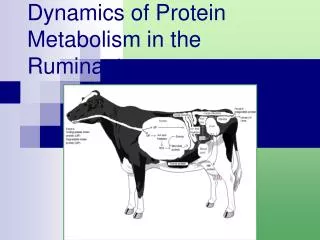
Ruminant Protein Nutrition--Other Topics. Urea Recycling Reducing NPN In Hay-Crop Silages 3. Ammonia Losses from Manure. Use of 15 N 15 N-Urea to Quantify Urea Catabolism in GIT. “Monomolecular Rxn”. Infused: 15 N 15 N-Urea + LiOBr Mass 30 N 2 Gas. Hydrolyzed:

E N D
Ruminant Protein Nutrition--Other Topics Urea Recycling Reducing NPN In Hay-Crop Silages 3. Ammonia Losses from Manure Ruminology-5--Reducing Environmental Impact from N-Excretion
Use of 15N15N-Urea to Quantify Urea Catabolism in GIT “Monomolecular Rxn” Infused: 15N15N-Urea + LiOBr Mass 30 N2 Gas Hydrolyzed: 14N15N-Urea + LiOBr Mass 29 N2 Gas Ruminology-5--Reducing Environmental Impact from N-Excretion
Use of 15N15N-Urea to Quantify Urea Catabolism in GIT “Monomolecular Rxn” Infused: 15N15N-Urea + LiOBr Mass 30 N2 Gas Hydrolyzed: 14N15N-Urea + LiOBr Mass 29 N2 Gas Ruminology-5--Reducing Environmental Impact from N-Excretion
Urea Metabolism Quantified in Sheep Using 15N15N-Urea (Lobley et al., 2000) (BW = 50 kg; Intake =1000 g/d) N dig (g/d) ~0.07 Ruminology-5--Reducing Environmental Impact from N-Excretion
Urea Metabolism in Ruminants(Lapierre & Lobley, 2001) (average data from 15N15N-urea studies in cattle & sheep) Ruminology-5--Reducing Environmental Impact from N-Excretion
Effect of Dietary RDP on Net Transfer of N to the Rumen (Meta-Analysis; Reynal & Broderick, 2006) Rumen N-Equilibrium at 11.2% RDP Ruminology-5--Reducing Environmental Impact from N-Excretion
Effect of Dietary RDP Content on Microbial Protein Yield (Meta-Analysis; Reynal & Broderick, 2006) Microbial CP, kg/d = 1.68(±0.27) + 0.082(±0.02)*% RDP (% of DM) (range = 7.5 to 18.7) (diet avg. = 27% NDF; 1.57 Mcal/kg of NEL) Ruminology-5--Reducing Environmental Impact from N-Excretion
Altering Diet to Lower N-Excretion 1NRC (2001) Model Ruminology-5--Reducing Environmental Impact from N-Excretion
Effect of Altering Diet on N-Excretion 1Estimated using NRC (2001) Model Ruminology-5--Reducing Environmental Impact from N-Excretion
Effect of Acid Treatment on NPN Content of Alfalfa Silage(Vagnoni et al., 1997) Ruminology-5--Reducing Environmental Impact from N-Excretion
Value of Reducing NPN in Alfalfa Silage onN-Utilization (Nagel & Broderick, 1992) Ruminology-5--Reducing Environmental Impact from N-Excretion
NPN Formation in Alfalfa (Alf) & Red Clover (RC) Extracts & Silage(Jones et al., 1995) Ruminology-5--Reducing Environmental Impact from N-Excretion
Expression of Red Clover PPO in Transgenic Alfalfa • In alfalfa, browning was dependent on: • A PPO transgene • Exogenous o-diphenol (e.g., caffeic acid) (Sullivan et al., Plant Phys. 136: 3234-3244, 2004) Ruminology-5--Reducing Environmental Impact from N-Excretion
How Well Does the Trans-Genic Alfalfa Work in Silo? • 25% Reduction in NPN in Silage from PPO-Alfalfa versus Control Alfalfa Control Alfalfa PPO-Alfalfa Ruminology-5--Reducing Environmental Impact from N-Excretion
Effect of Condensed Tannins onSilage NPN(Albrecht & Muck, 1991) Ruminology-5--Reducing Environmental Impact from N-Excretion
Forage Sources • Birdsfoot Trefoils (~ 2, 4, and 7% Extractable Condensed Tannin by Vanillin-HCl; Miller & Ehlke,1997) • Alfalfa • (No Polyphenols) Red Clover (Polyphenol Oxidase) Ruminology-5--Reducing Environmental Impact from N-Excretion
Forage Chemical Composition(Hymes-Fecht et al., 2005) a-cMeans with different superscripts differ. LBFT = low CT, NBFT = medium CT, HBFT = high CT Ruminology-5--Reducing Environmental Impact from N-Excretion
Experimental Diets (% of DM)(Hymes-Fecht et al., 2005) Ruminology-5--Reducing Environmental Impact from N-Excretion
Silage Source & Production (Hymes-Fecht et al., 2005) a-dMeans with different superscripts differ. LBFT = low CT, NBFT = medium CT, HBFT = high CT Ruminology-5--Reducing Environmental Impact from N-Excretion
Silage Source & Component Yield (Hymes-Fecht et al., 2005) a-cMeans with different superscripts differ. LBFT = low CT, NBFT = medium CT, HBFT = high CT Ruminology-5--Reducing Environmental Impact from N-Excretion
Silage Source & Urinary Excretion (Hymes-Fecht et al., 2005) a,bMeans with different superscripts differ. LBFT = low CT, NBFT = medium CT, HBFT = high CT Ruminology-5--Reducing Environmental Impact from N-Excretion
Silage Source & Apparent Total Tract Digestibility a-dMeans with different superscripts differ. LBFT = low CT, NBFT = medium CT, HBFT = high CT Ruminology-5--Reducing Environmental Impact from N-Excretion
N-Intake &Utilization(Castillo et al., 2000) Nm = 0.17*Ni + 41 ( . . ∆; r2 = 0.42) Nf = 0.21*Ni + 52 ( ; r2 = 0.48) Nu = 30.4*e0.0036Ni ( ; r2 = 0.76) Ruminology-5--Reducing Environmental Impact from N-Excretion
Misselbrook Apparatus to Estimate Ammonia Volatilization from Manure (Misselbrook et al., 2005) Chambers Contained Surfaces of either “Concrete” or Soil Ruminology-5--Reducing Environmental Impact from N-Excretion
Effect of CP (Solvent SBM) on Milk & Protein Yield(Olmos & Broderick, 2006) Ruminology-5--Reducing Environmental Impact from N-Excretion
Effect of Dietary [CP] & Condensed Tannins on NH3 Volatilization from from Fresh Manure on the “Barn Floor” (Misselbrook et al., 2005) Alfalfa silage 19.4% CP 13.5% CP HT-BFT LT-BFT Ruminology-5--Reducing Environmental Impact from N-Excretion
Effect of Dietary [CP] on NH3 Volatilization from Fresh (a) & Stored (b) Manure Slurries Applied to “Soil” (Misselbrook et al., 2005) 19.4% CP 19.4% CP 13.5% CP 13.5% CP Ruminology-5--Reducing Environmental Impact from N-Excretion
Relationship of Blood & Milk Urea (Broderick & Clayton, 1997) Ruminology-5--Reducing Environmental Impact from N-Excretion
MUN Mirrors BUN(Gustafsson & Palmquist, 1993) MUN (PM) BUN (Weighted avg.) = 17.0 mg/dl MUN (AM/PM avg.) = 20.7 mg/dl BUN MUN (RFQ) MUN (AM) Ruminology-5--Reducing Environmental Impact from N-Excretion
MUN & Dietary CP Content(Nousiainen et al., 2004) Milk Urea-N Strongly Related to [CP] but Influenced by Other Factors Ruminology-5--Reducing Environmental Impact from N-Excretion
Effect of Ruminal NH3 on MUN(MTT Data) Ruminology-5--Reducing Environmental Impact from N-Excretion
MUN & Rumen N-Balance(MTT Studies) Ruminology-5--Reducing Environmental Impact from N-Excretion
MUN & N-Efficiency (MTT Data) Ruminology-5--Reducing Environmental Impact from N-Excretion
Relationship of Urinary N to MUN (Nousiainen et al., 2004) Kauffman & St-Pierre Nousiainen et al. Jonker et al. Ruminology-5--Reducing Environmental Impact from N-Excretion
Prediction of Urinary N from MUN Output & Dietary [CP](MTT Data) (Urinary-N = NI - Milk-N - Fecal-N) Ruminology-5--Reducing Environmental Impact from N-Excretion
What About Bulk Tank MUN?(USDFRC, March 1 - 25, 2006) • Source Mean CV Range • low high • Fat, % 3.77 2.1% 3.53 3.90 • Protein, % 2.93 2.3% 2.85 3.20 • SCC, thousand 370 8.7% 309 453 • MUN, mg/dl 10.5 11.2% 8.8 12.7 • (MUN rose from 9.5 to 12.7 in 1 day) Ruminology-5--Reducing Environmental Impact from N-Excretion
Number of Cows on a Diet to Sample for MUN (Broderick & Clayton, 1997) • GLM Determined SD for 1 Cow Within Diet: Mean MUN = 14.8 mg/dL; SD = 2.07 • Confidence Interval (CI) = ± 1.96*SD/(n)^0.5 • Sample for CI = ± 1 or 2 mg/dL: n = (1.96*2.07/1)^2 = 16.5 n = (1.96*2.07/2)^2 = 4.1 • About 16 or 4 Cows Must be Samples for Mean MUN Within ± 1 or 2 mg/dL Ruminology-5--Reducing Environmental Impact from N-Excretion
Percent Dietary Concentrate (PCO), Defaunation & Rumen pH(Eugene et al., 2004) Ruminology-5--Reducing Environmental Impact from N-Excretion
Effect of Defaunation on Rumen NH3(Eugene et al., 2004) Ruminology-5--Reducing Environmental Impact from N-Excretion