Download
1 / 34
340 likes | 482 Vues
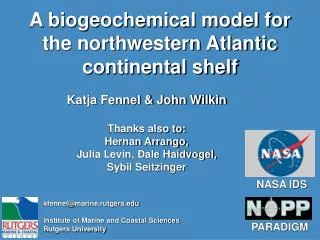
A biogeochemical model for the northwestern Atlantic continental shelf. Katja Fennel & John Wilkin Thanks also to: Hernan Arrango, Julia Levin, Dale Haidvogel, Sybil Seitzinger. NASA IDS. kfennel@marine.rutgers.edu Institute of Marine and Coastal Sciences Rutgers University. PARADIGM.

E N D
A biogeochemical model for the northwestern Atlantic continental shelf Katja Fennel & John Wilkin Thanks also to: Hernan Arrango, Julia Levin, Dale Haidvogel, Sybil Seitzinger NASA IDS kfennel@marine.rutgers.edu Institute of Marine and Coastal SciencesRutgers University PARADIGM
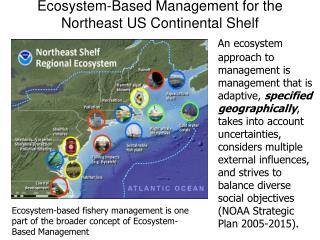
Objectives • examine biogeochemical cycling of carbon, nitrogen, oxygen and other essential elements at ocean margins and the land-ocean interface • investigate the fate of inorganic and organic matter inputs from land • assess the effects of anthropogenic perturbations and natural variability on the coastal ecosystems
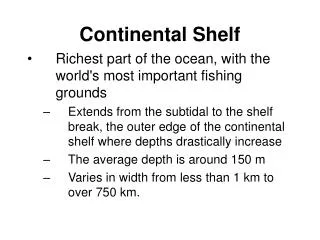
Continental shelves • High productivity • Most burial on shelves and slope • Basis for world’s fisheries • Vulnerable to anthropogenic nutrient loadings • Shelf processes widely ignored in basin-wide and global models
SSH (m) North Atlantic ROMS Climatological heat/freshwater fluxes 3-day average NCEP winds
Initial and boundary conditions for biological variables: • Nitrate: • NODC data from 30o – 50oN and 60o – 80oW • Temperature and Salinity approximations for water masses of Shelf and Slope/Open Ocean separately • Others: • Small positive values of ~0.1 mmol N m-3 Shelf water Slope/open ocean NODC nitrate data in T-S diagram
Initial and boundary conditions for biological variables: • Nitrate: • NODC data from 30o – 50oN and 60o – 80oW • Temperature approximations for water masses of Shelf and Slope/Open Ocean separately • Others: • Small positive values of ~0.1 mmol N m-3 Slope/open ocean Shelf water
Nitrification Water column Mineralization NH4 NO3 Uptake Phytoplankton Grazing Chlorophyll Zooplankton Mortality Large detritus Susp. particles Nitrification N2 NH4 NO3 Denitrification Aerobic mineralization Organic matter Sediment
Sediment remineralization • Org. matter reaching the bottom is remineralized instantaneously • Remineralization is distributed between oxic and anoxic pathway • Denitrification is related to carbon oxidation (measured as sediment oxygen uptake) • 1 mol org. matter ~ 4 mol NH4, 6 mol N2 From Seitzinger & Giblin (1996)
Boundary effect Mean annual PP in MAB: 200 gC /m2 /y Observational estimates: 290 gC /m2 /y in New York Bight (Malone et al. 1983) 310 gC /m2 /y in MAB (O’Reilly and Busch 1984)
Middle Atlantic Bight (MAB) Georges Bank Nantucket Shoals Hudson Delaware Chesapeake Cape Hatteras 50, 100, 200, 500 1000 m isobaths: dashed lines
2-yr simulations, starting from same initial condition in January 1994 after a 1-yr spinup
no DNF; no river N no river N
Mean annual denitrification flux in MAB: 1.1 mmol N /m2 /d Observational estimates for North Atlantic Shelves: 0.7 mmol N /m2 /d Nova Scotia to Cape Hatteras: 1.4 mmol N /m2 /d (Seitzinger and Giblin 1996)
denitrification removes 90% of all N entering MAB DNF: 5.3 TN 4.2 TN Rivers: 1.8 TN 0.4 TN Fennel et al. (submitted to Global Biogeochemical Cycles) x 1010 mol N y-1
denitrification removes 90% of all N entering MAB • cross-isobath export of PON, import of DIN DNF: 5.3 TN 4.2 TN 3.3 DIN 0.9 PON Rivers: 1.8 TN 2.5 DIN 2.9 PON 0.4 TN Fennel et al. (submitted to Global Biogeochemical Cycles) x 1010 mol N y-1
From Seitzinger and Giblin (1996)
N2 fixation Denitrification N = 25790 N* = N – 16 P (Gruber & Sarmiento 1997)
Is Denitrification on Continental Shelves Significant in North Atlantic N-cycle? Extrapolation of DNF rate to North Atlantic shelf area: 2.3 x10¹² mol N y-1 North Atlantic Nitrogen fixation: 3.7 – 6.4 x10¹² mol N y-1 (Michaels et al. 1996) 2.3 x10¹² mol N y-1 (Gruber & Sarmiento 1997) 0.3 x10¹² mol N y-1 (Hansell et al. 2004) Estimated shelf denitrification flux is 35 – 700% of estimated N2 fixation flux.
Implications for C-cycle Assume: N supply to MAB is matched by C supply in Redfield ratio; N loss due to denitrification is matched by outgassing of CO2 to atmosphere 5.3 x10¹⁰ mol N y-1 ~= 4.2 x10¹² gC y-1 Extrapolated to North Atlantic shelf area: 0.18 PgC y-1 30% of the North Atlantic C uptake -0.6 PgC y-1 (Takahashi et al. 2002)
Outlook • Also available: • Carbon and Oxygen chemistry • More complex ecosystem (Lima and Doney 2004) • In the future: • Dynamic sediment component • Data assimilation
Courtesy: Jay O’Reilly
SST Span (Annual Range in monthly mean SST) 1985-2005 Courtesy: Jay O’Reilly
Total time-space statistics for test field p and reference field q:
Spatial-monthly statistics with skill metric: Statistics like spatial-annual but for each month Skill metric (0<=S<=1, S→1 as p approaches q)


![The European North Atlantic shelf [Ocean-Shelf Exchange, internal waves]](https://cdn2.slideserve.com/3935069/the-european-north-atlantic-shelf-ocean-shelf-exchange-internal-waves-dt.jpg)