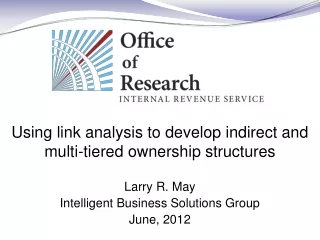
Using link analysis to develop indirect and multi-tiered ownership structures
400 likes | 415 Vues
This article explores the use of link analysis to identify indirect and multi-tiered ownership structures in enterprises. It discusses common control, relevant indicators, and highlights the dominance of small enterprise structures. Related research areas and supplemental tables are also provided.

Using link analysis to develop indirect and multi-tiered ownership structures
E N D
Presentation Transcript
Using link analysis to develop indirect and multi-tiered ownership structures Larry R. May Intelligent Business Solutions Group June, 2012
What is an Enterprise? • Enterprise structures are an attempt to identify all economic activity under the common control of a taxpayer. • Currently limited to flow-trough relationships, parent/subsidiary links, and primary/secondary SSN associations. • Also limited to structures with at least two business returns.
What is common control? • Control is direct and indirect ownership of 50% or more of another entity consistent with the rules set forth in IRC section 267(c) and section 707(b). • Allocation proportions are used as a proxy for ownership percentage. • Other items which may assist in identifying related parties include name similarities, TIN sequencing, common address and common preparer.
Icon Legend High Income High Asset A
Icon Legend High Income High Asset G F B E C D 50% 5% 30% 100% 10% 100% A
Icon Legend High Income High Asset G F B E C D 50% 5% 30% 100% 10% 100% A
Icon Legend High Income High Asset H 100% 20% 20% 50% G F B 15% E C D 50% 5% 30% 100% 10% 100% A
Icon Legend High Income High Asset H 100% 20% 20% 50% G F B 15% E C D 50% 5% 30% 100% 10% 100% A
Icon Legend High Income High Asset D G 20% 20% 5% 15% F H 100% 50% 50% B E C 30% 100% 10% 100% A
Icon Legend High Income High Asset D G 20% 15% 20% 5% 15% F H 100% 50% 50% B E C 30% 100% 10% 100% A
Icon Legend High Income High Asset D G 20% 15% 20% 5% 15% F H 100% 50% 50% B E C 30% 100% 10% 100% A
Icon Legend High Income High Asset D G 30% 20% 15% 20% 5% 15% F H 100% 50% 50% B E C 30% 100% 10% 100% A
Icon Legend High Income High Asset G 30% D 20% 15% 20% 5% 15% F H 100% 50% 50% B E C 30% 100% 10% 100% A
Icon Legend High Income High Asset 33% G J 30% D 20% 15% 20% 5% 15% F H 100% 50% 50% B E C 30% 100% 10% 100% A
Icon Legend High Income High Asset G 30% D 20% 15% 20% 5% 15% F H 100% 50% 50% E C 100% 10% 100% A
Icon Legend High Income High Asset 33% G J 30% D 20% 15% 20% 5% 15% F H 100% 50% 50% B E C 30% 100% 10% 100% A
Icon Legend High Income High Asset 33% G J 30% D 20% 15% 20% 5% 33% 15% F H 100% 50% 50% B E C 30% 100% 10% 100% A
Icon Legend High Income High Asset 15 D 13 A 33% G J 30% D 20% 15% 20% 5% 33% 15% F H 100% 50% 50% B E C 35% 30% 100% 10% 100% 35% L K A Gustufsan Smith Smith
Icon Legend High Income High Asset G 30% D 20% 15% 20% 5% 15% F H 100% 50% 50% E C 100% 10% 100% A
A Simple Enterprise There are 2 other investors (3 in total) in this partnership but this individual has more than 50% ownership This taxpayer has 5 investments but he has a controlling interest in only the 3 shown
One-third (33.68%) of the 1,000,000 enterprises take one of the following six structures 9.74% 6.92% 4.96% 4.57% 3.95% 3.55%
Enterprise Highlights • Over 900,000 are controlled by an individual. • About 50,000 are LB&I controlled. • The Real Estate Industry dominates. • About 20% contained either an initial or final year return. • Usually the same preparer prepared most of the returns. • Enterprises usually have very few investors other than the controlling owner.
Related Areas of Research • Name Similarity analysis • Familial Relationships • Other Heuristics of Relationship and Control • Boundary Refinement (Merging Ent.) • Aggregation methods for data • Risk Assessment • Enterprise Profile • Other…
Thank You for Your Time and Attention Larry R. May larry.r.may@irs.gov
Asset Range by Owner Type Proportion Tiered by Tier Depth
Initial/Final Status by Entity Range Preparer Coverage by Entity Range
Minority Investors by Entity Range Allocation Amount by Entity Range