Download
1 / 73
750 likes | 932 Vues
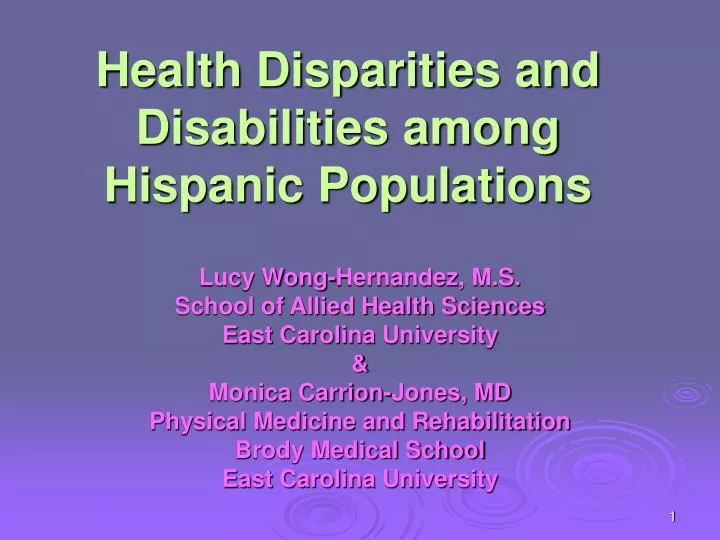
Health Disparities and Disabilities among Hispanic Populations. Lucy Wong-Hernandez, M.S. School of Allied Health Sciences East Carolina University & Monica Carrion-Jones, MD Physical Medicine and Rehabilitation Brody Medical School East Carolina University. Objectives.

E N D
Health Disparities and Disabilities among Hispanic Populations Lucy Wong-Hernandez, M.S. School of Allied Health Sciences East Carolina University & Monica Carrion-Jones, MD Physical Medicine and Rehabilitation Brody Medical School East Carolina University
Objectives • Identify the target population • Identify health disparities among this population • Causes of Health Disparities and Disabilities • How can we decrease the gap
Hispanic Population • This ethnic group includes any person of Cuban, Mexican, Puerto Rican, South or Central American, or other Spanish culture or origin, regardless of race. • According to the population estimates of the U.S. Census Bureau review of 2006, there are approximately 42.6 million Hispanics in the U.S. (14% of total population).
Health Disparities • As define by the National Institute of Health (NIH) “…health disparities indicatesdifferences in the • incidence, • prevalence, • mortality, and • burden of diseases and other adverse health conditions that exist among specific population groups in the United States."
Cancer Diabetes Heart Disease HIV/AIDS Immunization Infant Mortality Stroke Asthma Work-Related Injuries Areas of Health Disparities
Cancer • In 2003, Hispanic men were 19% less likely to have prostate cancer as non-Hispanic white men. • In 2003, Hispanic women were 39% less likely to have breast cancer as non-Hispanic white women. • Hispanic men and women have higher incidence and mortality rates for stomach and liver cancer. • In 2003, Hispanic women were 2.2 times as likely as non-Hispanic white women to be diagnosed with cervical cancer.
Diabetes • In 2003 Mexican American adults were 2 times more likely than non-Hispanic white adults to have been diagnosed with diabetes by a physician. • In 2002, Hispanics were 1.5 times as likely to start treatment for end-stage renal disease related to diabetes, as compared to non-Hispanic white men. • In 2003 Hispanics were 1.5 times as likely as non-Hispanic Whites to die from diabetes.
Heart Disease • In 2004, Hispanics were 10% less likely to have heart disease, as compared to non-Hispanic whites. • In 2003 Mexican American men were 30% less likely to die from heart disease, as compared to non-Hispanic white men. • Mexican American women were 1.2 times more likely than non-Hispanic white women to be obese.
HIV / AIDS • Hispanics accounted for 18% of HIV/AIDS cases in 2004. • Hispanic males had over 3 times the AIDS rate as non-Hispanic white males. • Hispanic females had over 5 times the AIDS rate as non-Hispanic white females. • Hispanic men were 2.7 times as likely to die from HIV/AIDS as non-Hispanic white men. • Hispanic women were 4.5 times as likely to die from HIV/AIDS as non-Hispanic white women.
Immunization • In 2004 Hispanic adults aged 65 and older were 20% less likely to have received the influenza (flu) shot in the past 12 months -- as compared to non-Hispanic whites of the same age group. • In 2004, Hispanic adults aged 65 and older were 40% less likely to have ever received the pneumonia shot, -- as compared to non-Hispanic white adults of the same age group. • Although Hispanic children 19 to 35 months old had comparable rates of immunization for hepatitis, influenza, MMR, and polio -- they were slightly less likely to be fully immunized, when compared to non-Hispanic white children.
Infant Mortality • In 2003, infant mortality rates for Hispanic subpopulations ranged from 4.6 per 1,000 live births to 8.2 per 1,000 live births, compared to the non-Hispanic white infant mortality rate of 5.7 per 1,000 live births. • In 2003, Puerto Ricans had 1.4 times the infant mortality rate of non-Hispanic whites. • Puerto Rican infants were 2.1 times as likely to die from causes related to low birth weight, as compared to non-Hispanic white infants. • Mexican American mothers were twice as likely as non-Hispanic white mothers to begin prenatal care in the 3rd trimester, or not receive prenatal care at all.
Asthma • During 1993-1995 in the northeast U.S., Hispanics/Latinos had an asthma death rate of 34 per million -- more than twice the rate for white Americans (15.1 per million).
Work-Related Injuries • Mexican foreign born workers accounted for more than two thirds (69 percent) of the 2,440 fatally injured, foreign born workers between 1995 and 2000. • Lower percentages of fatally injured workers came from Cuba (146 or 6 percent), El Salvador (131 or 5 percent), Guatemala (90 or 4 percent), and Dominican Republic (87 or 4 percent).
Stroke • In 2003, Hispanic men were 20% less likely to die from a stroke than non-Hispanic white men. • In 2003 Hispanic women were 30% less likely to die from a stroke than non-Hispanic white women.
Causes of Health Disparities • Socioeconomic factors • Lifestyle behaviors • Social and built environment • Access to preventive health-care services • Access to affordable health insurance
Socioeconomic factors • Education attainment • Employment • Poverty • Insurance coverage
NO Usual Place of Care(Preventive care in a clinic or health center VS. doctor’s office)
Lifestyle behavior • Lack of physical activity • Alcohol intake • Smoking • Food intake (diet)
Social Environment • Educational and economic opportunities • Racial/ethnic discrimination • Neighborhood and work conditions • Lack fluency in English • Lack of familiarity with the U.S. health-care system
Access to preventive health-care services • Cancer screening • HIV screening • Vaccination • Pre-natal care
How do we eliminate the GAP? • Increment National Standards on Culturally and Linguistically Appropriate Services. • Community education that involves all members of the community • Knowing the problem and the causes (Research). • Promoting preventive health care that is also culturally sensitive.
DISABILITY AMONG HISPANICS ****
Disability Overview: • Disability Definition • Access & Challenges • Health & Disability Disparities Issues • Cultural Sensitivity & Competency • Recommendations for Research
DISABILITY • Disability definition: • The condition of having a disability or limitation. • The period or length of such a condition • A disadvantage or deficiency, especially a physical or mental impairment that interferes with or prevents normal achievement in a particular area or major life activities of the individual. • Law: A legal incapacity or disqualification.
In 2005, an estimated 20.6% civilians not living in an institution (or 53.9 million people) met the criteria for disability. Women and girls with disabilities are estimated to number 28.6 million, which is 21.3% of the female population. An estimated 25.3 million men and boys with disabilities make up 19.8% of the male population. One in five Americans has a diagnosed disability; more than half of those with disabilities are female.
Females report more limitations in old age, while males report more limitations in youth.
Disabilities in NC • Approximately: 1,139,375 adults 18 and over experience a disability. • Representing 18.3% of the population • Women: 19.4% or 648,215 • Men: 17.0% or 491,160
Rate by Age: Age 5 to 20 = 7.4 % Age 21 to 64 = 14.4% Age 65 and over = 43% Causes: Genetic Work related injuries Automobile and industrial accidents Environmental contamination Rate by Race & Ethnicity: Hispanics 13.8% Whites non-Hispanics 18.5% Blacks 19.1% Native Americans 23.5% Disabilities in NC
Demographic Trends • It is projected that by the year 2020, --- 30% of the new workers entering into the labor force will be people from diverse cultural and ethnic backgrounds --- also classified as people from minority backgrounds. • According to data from the Department of Labor: • There is a higher incidence of work disabilities among minorities: 13.7% --- of African Americans 8.2% --- of Hispanic Americans AS COMPARED TO: ONLY 7.9% --- of White Americans who acquired a work related disability.
What is Culture? • Culture is a collective reality of a group of people --- and it is from this collective reality --- that attitudes, behaviors, and values are formed and become reinforced among a group of people. • Culture is commonly held characteristics such as beliefs, values, customs and patterns of behaviors held by a group, which has been learned and reinforced through a socialization process.
Hispanic / Latino • The Hispanic American population: is the fastest growing and most diverse ethnic group in the U.S. • According to the latest US Census report of 2000 --- and its latest revision (2005) – the U.S Hispanic or Latino population is projected to grow from 31.7 million (12% of the population) in 1999 -- to 98.2 million (24% of the U.S. population) by 2050. • This indicates the Hispanic American population has grown over 7 times ---- and as fast as the rest of the nation --- between 1980 to 1990 and 1990 to 2005.
Hispanic • Hispanic is not a racial group – it is an ethnic group (including White Europeans, Blacks, Asians of various ethnic groups including indigenous and “mestizos”). • Hispanics are united by a common language – but not all Hispanics are fluent in the Spanish language. • 15.3 % --- have some type of disability (US). • They are mostly affected by what is labeled as “preventable causes of disability.”
Access to Health Care among Hispanic Women: U.S., 2000-2002* Among the nation’s 33.4 million Hispanic women: • 31% do not have health insurance coverage; • 20% do not have a usual clinic to go for medical care; and • 22% experienced unmet health care needs during the past year due to cost. *Centers for Disease Control and Prevention (CDC, 2005)
What is “Health Disparity?” A health disparity is a difference in health status that is persistent across subgroups of a population. Source: http://www.health.state.mn.us/
Consequences of Health Disparities • Absence of and poor health care contributes to chronic illnesses. • Chronic illnesses become permanent disabilities. • Disabilities may become complicated by secondary disabling conditions. • There is close correlation between disability and poverty. • 25% of the population diagnosed as disabled is living at poverty level or lower.
Health Disparities among Persons with Disabilities • Less health insurance coverage and use of the health care systems. • Higher rates of chronic illnesses and secondary conditions. • Lower rates of social participation. • Lower rates of recommended health behaviors (e.g. smoking cessation, diet, etc). • Less participation in health screening (women with disabilities).
Health & Disability Disparities • Over 53 million Americans have either a severe or a non severe disability • Disparities in rates of disability are pronounced for culturally diverse groups • Hispanic Americans with disabilities are second to African Americans with disabilities with a 20.0% • Self-reported health status is one of the lowest at: 30.4% for Good and 47.7% for Poor health.