Download
1 / 84
840 likes | 970 Vues
Supernovae are the brightest explosions in the universe, offering insights into cosmic phenomena. Historically, notable supernovae recorded include those in 1054 (Crab Nebula) and 1987A in the Large Magellanic Cloud. These explosions help in classifying various types of supernovae and measuring cosmic distances. Additionally, they play a crucial role in understanding dark energy and the universe's expansion rate. Current studies focus on Type Ia supernovae as standard candles to investigate the universe's accelerating expansion and its underlying mechanisms.

E N D
SN and Dark Energy Charling TAO, June 2010
Supernovae • Brightest objects in the Universe : star explosions • Nearest ones can be seen with naked eyes: rare! 8 in 2000 years • Historical Super(novae) Chinese archives 185, 369, 1006 (arabo-persian ), 1054, 1181. • 1054: Crab nebulae (M1) Intense Emission: radio, X et gamma • 1572 (Tycho Brahe), 1604 (Kepler) • visible during the day • 1987A LMC : UV, X, radio, visible, + neutrinos !
SN Classification Historical! • Type I : absence hydrogen lines +Type Ia: presence ionised SiII +Type Ib: absence Si, presence helium +Type Ic: absence Si et helium • Type II: Présence hydrogen Ha et Hb + Type II normal: domination hydrogen, presence helium. IIL (linear) or IIP (plateau) according to Light Curves +Type IIb : dominantpresence helium • Type « peculiar »
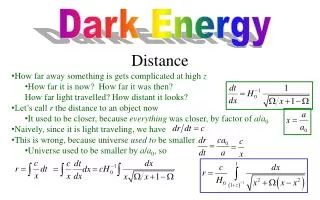
Cosmology: Measuring distances Cosmology: additional a(t) scale factor 宇宙距离因子 D(t) = a(t) D(t0) a(t) = a0(1+ H0t -1/2 q0 (H0t)2 + …) SN 1996 H0 = Hubble parameter measures the expansion rate of the Universe H0= (a/a)0 = 100 h km/s/Mpc , h= 0.72 +/- 0.05 (?) q0 = deceleration parameter A Universe with only matter is expected to decelerate . .
Supernovae type Ia Best known « standard » candles Red giant White dwarf Chandrasekhar mass 1.4 MO SNIa : 2 stars accretion (a white dwarf +…) Chandrasekhar mass 1.4 MO Detailed explosion physics not clear yet. Worth studying!
SNIa and Cosmology 1998 SURPRISE: Indication for negative deceleration parameter q0 Acceleration!!! But only 2s effect! B magnitude at maximum W = r(t)/rc(t) = WM+ WL • = 1- Wk L = L/3H02 q0= 1/2 WM- WL < 0 Hubble diagram Redshift z
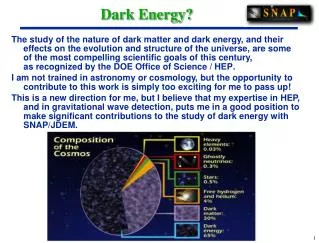
A mysterious Universe SNe Ia CMB 宇宙微波背景 (WMAP) Universe is mainly dark LSS 大尺度结构 ~70% DE and ~25% DM. Definition:W=r/rc (rc=10-29 g/cm3)
The concordance model stands quite strong! Snapshot at ~400,000 yr, viewed from z=0 CMB Angular diameter distance to z~1000 Growth rate of structure (from ISW) Supernovae Standard candle Luminosity distance Evolution of dark matter perturbations Cosmic Shear Angular diameter distance Growth rate of structure Cluster counts Evolution of dark matter perturbations Angular diameter distance Growth rate of structure Baryon Wiggles Standard ruler Angular diameter distance
Power of Combinations DE Task force astro-ph 0609591 Caveat: Beware in case of different central values! • use other probes, especially necessary for equation of state not constrained by CMB
A mysterious Universe ! What we know is only 4% of the energy density of the Universe Graph source: Wikipedia Definition:W=r/rc (rc=10-29 g/cm3)
w =-1 • How to distinguish them? • equation of state 物态方程 w(z) = p/r What is this Dark Energy? New form of « field/matter? » Quintessence? Unified Dark Matter? • ModifiedGravity/GR ? • Non minimal Couplings? • Extra-Dimensions? • Anisotropy/ inhomogeneity effects? • Negative energy? • …. Cosmological Constant???
Probably too naive ! LSS formation and evolution are probes of initial perturbations and DE! Need not only w(z), but also growth rate, and understanding of non-linear features.
Nonetheless Measure dw/dz = a challenge ! • Motivation= separate the different theoretical interpretations • A difficult estimate (sw’< 10 %) • Hypothesis to control • w=p/r parametrisation • Other cosmoogical parameters Wm… • Sensitivity to systematics to % • A necessity .. • Compare and combine probes Identify, evaluate and reduce systematical effects
How can Dark Energy be better measured? • CMB: Planck • Type Ia Supernovae: dL(z) to z 2 • Ongoing with various ground-based/HST surveys • Key issue is physics/evoln: do we understand SNe Ia? • Weak lensing: G(t) to z 1.5 • Promising; requires photo-z’s • Key issues are fidelity, calibration • Cluster counts: dA(z), H(z) - accuracy/non-linearities? • Baryon “wiggles”: dA(z), H(z) to z=3 • Late developer: cleanest but requires huge surveys • AP test • ISW effect
>2017? EUCLID ? 2017? Surveys to measure Dark Energy 2015 2005 2010 Imaging CFHTLS SUBARU DUNE LSST SKA DES, VISTA Hypersuprime DLS SDSS ATLAS KIDS JDEM Pan-STARRS Spectroscopy FMOS WFMOS SKA LAMOST SDSS ATLAS Supernovae CSP ESSENCE DES LSST Pan-STARRS JDEM/ SNAP CFHT-SNLS Clusters AMI APEX SPT DES XCS SZA AMIBA ACT CMB WMAP 2/3 WMAP 6 yr Planck 2005 2010 2015
The “classical” SN observation method A 3 steps method: • Discovery: subtraction from a reference image. • Supernova type identification and redshift measurement • Photometric follow-up: light curve spectrum Final analysis: Hubble diagram.
Spectral Identification SNIa Spectrum at maximal luminosity Most spectra very similar 2 random SN shown NO quantitative model/understanding of explosion yet (Model + radiative transfer) Ca - Most absorption lines strongly blended - Lines are WIDE: velocity spread from explosion - No Hydrogen lines: blown out before - Strong Ca absorption lines - Strong and characteristic Si line • Identification from light curve alone may be possible Fe Fe Si O S Ca SNLS: spectrum fit to library!
Less luminous/z => Accelerated expansion less matter or more dark energy Too luminous/z => Slowed down expansion => deceleration More matter, less dark energy The Hubble diagram with SNIa 星等 Absolute magnitude m(z) = M + 5 log (DL(z,WM,WL))-5log(H0)+25
Fit cosmological parameters • From Hubble diagram, fit models • Determine dark energy parametersWL, or (WX, w, w’)and matter densityWM mag z 1
Current Supernova Surveys “Concordance” M ~ 0.3 ~ 0.7 Science Goals: cosmology rates physics CfA,CSP,LOSS,SNF, ... SDSS ESSENCE,SNLS Higher-Z
CFA3,Hicken et al., 0901.4804 Number Type Ia from SN Surveys Union Sample: Kowalski et al, 2008
SNIa latest results:Union 2 compilation Amanullah et al, astro-ph 1004.1711
Current cosmology results Union2 compilation 2010 equation of state w=p/r = -1 for cosmological constant Chevallier-Polarski, Linder parametrisation w= w0 +wa a/(1+a) , a == cosmological scale factor 2010 combination: Sun L. et al.
DARK ENERGY:MULTIPROBE ANALYSISUSINGEGEE AND EUCHINA data grids Sino French collaboration CPPM/CPT/IHEP/PKU/NAOC/ Beijing Normal U. Many people involved Cf Tilquin presentation THCA Dec.2009
SuperNova Legacy Survey (2003-2008) • 5 year survey • Uses CFHT/“Megacam” • 36 CCDs, good blue response • 4 filters for good k-corrections and color measurement Megaprime
SNLS: Current status • Survey completed summer 2008 • ~400 spectroscopically confirmed distant z>0.1 SNe Ia • ~ Largest single telescope sample of SNe • (>1000/>2000 total SNIa/All SN light-curves)
First-Year SNLS Hubble Diagram SNLS published 1st year Astier et al. 2006 ΩM = 0.263 ± 0.042 (stat) ± 0.032 (sys) <w>=-1.02 ± 0.09 (stat) ± 0.054 (sys)
“Third year” SNLS Hubble Diagram (preliminary) Best-fit for SNLS+flatness Preliminary error was 0.042 in Astier 2006 ΩM=0.3, Ωλ=0 ΩM=1.0, Ωλ=0
Summary/SNLS SNLS: • has already collected >400 (spectro id) SN Ia in ~5 yr. • When combined with BAO, 1st year results on w favor a Cosmological constant as the source of acceleration • improvement expected in both stat. and systematics High z sample dominated by systematic effects What we learnt: • The power of (multicolor & rolling) imaging : SN identification, control of systematics. • Calibration is delicate • Environment matters (also at high-z) • Need improved LC modeling (using SNLS data -> SALT2) • Need unbiased nearby sample
“Near” Future Prospects with SN • Current constraints on <w>: <w>=-1 to ~6-7% (stat) • <w> > -0.8 excluded at 3-sigma level • a 4-5% statistical measure will be achieved: • 400 SNLS + 200(?) SDSS + new local samples SNFactory • Improved external constraints (BAO, WMAP, WL) • Systematic errors becoming ever more important
Discovery: Two cameras (one wide field) 1.2 m ground based telescopes: NEAT/QUEST Lightcurve follow-up with YALO Photo-spectro follow-up with Field IntegralSpectrometre(SNIFS) at UH 2.2m telescope (Hawaii) Nearby SNFactory National Energy Research Scientific Computing Center
SNFactory: THE nearby SN spectro-photometric database 0.03 < z < 0.08
Nearby Supernova Factory - Goals: addressing SNIa systematics - Tools: precise spectro-photometry Anchoring the Hubble diagram at low z • Fix the low SNIa magnitude to Dm=0.02!!!
The SNFACTORY collaboration • Nearby 0.03<z<0.1(Hubble flow + exposure time) • Measure spectra at all dates : improve light curve measurements In photometric filters (time dependent create templates) • Measure the total flux: no slit spectroscopy Integral Field Spectrograph • SNFACTORY Collaboration:US-France +Germany + Tsinghua? • Search at Quest: 1m,Palomar, Yale CCD Camera (US teams) • Spectroscopy: at UH 2m with IFS SNIFS from Lyon • Statistics are still useful for systematic studies • Systematic studies very important for future SN projects
The SNIFS Integral field Spectrograph Cal. Filter wheel • 2 channel spectroscopy 320-520, 510-1000 nm • Photometry 9.5’x9.5’ field of view acquisition of images guiding Extinction monitoring • Internal Calibration Arc Lamps + Continuum • 0.43x0.43 arcs/microlens P Tel Dichroic B Microlens Arrays 15x15 Galaxy + SN 6x6 arcs R
Search in SNFACTORY SNIa thermonuclear SNII gravitational collapse H lines No Si SNIb,c = SNII no H (blown) + some Si First light SNIFS 2004 Smooth data taking spring 2005
Galaxy Subtraction /deconvolution (in progress) Galaxy subtracted B Channel SN + Galaxy 10 wavelength metaslices
Peculiar SNIa Super Chandrasekar SNIa 2 WD?
SN Factory: Library of Time Series of Spectra of Type Ia Supernovae Library of Spectral Time Series SN Factory SNe (time series of spectra over the lightcurve)
data analysis physics The « classical » method galaxy magnitude z(redshift) Images Hubble + identification. Spectra Ia
SN Ia are not exact standard candles! The light of SNIa explosions can be followed up for several weeks with telescopes magnitude SNIa Light curves
Different standardisation methods Standardisation to Dm =0.2 Before:mB After, eg, stretch correction: mBcor = mB – a (s-1) stretch (SCP), MLC2k2 (HiZ), Dm15, .. DC12 : WangXiaofeng, + other new ideas, to test on real data
Systematic differences between standardisation methods (Riess et al. 2004)
A shift of Dm=0.27 of nearby (2004) Shift Dm= 0.27 for z <0.15 Wm= 0.43 +/-0.2 et WL= 0 +/-0.34 « 2 s » effect • No need for L • But Universe is not flat Kosmoshow A. Tilquin
SNIa systematic effects Rowan-Robinson astro-ph/021034 Perlmutter & Schmidt 0303428 Extragalactic Environnement Observation SN environment Normal dust Gravitational lensing Grey dust SN evolution reduction/correlations Contaminations non SNIa Selection bias Inter calibration filters Standardisation methods
SNIa: Systematic Errors are quantified Long list! “Shows maturity of SN cosmology field” ( J. Peacock)