Download
1 / 29
290 likes | 353 Vues
Explore railroad pricing over space, focusing on intermodal competition, port efficiency, choice modeling, and congestion analysis. Investigate the impact of barge competition and market constraints on rail rates.

E N D
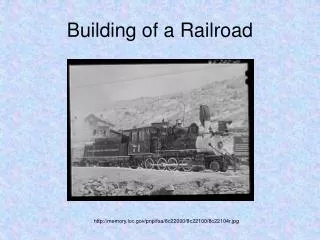
A Study of Pricing over Space in Railroad Markets Kevin E. Henrickson Gonzaga University & Wesley W. Wilson University of Oregon
Navigation and Economics Technology Program A group of academic economists working with the Army Corps of Engineers to develop the economics underlying benefit measurement of investments in the waterways. • Choice modeling • Spatial Equilibrium • Spatial Econometrics • Congestion modeling • Port Efficiency • Port Choice • Forecasting transportation traffic. All research on www.Corpsnets.us and there is a link to a monthly newsletter called Nets News link This is one paper in the sequence to examine the competitive relationship between railroads and the waterways.
Introduction • Most railroad shippers have service from one railroad. These are “captive” shippers. • Deregulation and merger activity increased the number of captive shippers over the last 25 years. • But, even captive shippers have options. These include: other products, destinations, modes, and various combinations. • These are the original market dominance criteria of the ICC.
Introduction • Our focus is on waterways, but there are lots of different potentially constraining options. • Our results indicate that both inter- and intra-modal competition, as well as competition from other industries constrain railroad pricing power.
Key Empirical Papers • MacDonald (1987) uses the Waybill data set to examine the impact of barge competition on rail rates for shipments of wheat, corn and soybeans • Burton (1995) also uses the Waybill data set to explore the effects of barge competition on rail rates for a variety of goods
Theoretical Model • The focus of our work is on the rail shipments originating from various points in geographic space • Shippers maximize profits by simultaneously choosing both the destination market for their product, and their mode of transportation (truck, rail, barge)
Theoretical Model • Railroads recognize the shipper’s profit maximization problem and choose the rail rate to charge the shipper by solving:
Theoretical Model • This leads to a first order condition (r-mc) / r = (λ-1) / ε λ=Constraint on market power (=1 if r=mc, and 0 if monopoly rate, between 0 and 1 “constrained market dominant”). We use this to frame our empirical model:
Theoretical Model • Directly from the first order conditions, it can be shown that the railroad’s profit maximizing rate is: • Where the markup term is a function of the competitive options available to the shipper.
Variables • Note that the cost variables are observable to us and include: • The distance of the shipment, • The volume of the shipment, and • Whether the shipment is part of a unit train or not • The markup variables include: • The distance to the nearest waterway, and • The existence of alternative markets
Data • The geographic “shipper” locations come from the Farm Service Agency’s Warehouse Database • Randomly selected from states which are 1st or 2nd degree contiguous to the Mississippi River:
Data • Rail rates collected for each location directly from service providers via their websites • Rates obtained for shipments of corn to the Gulf Coast and to Portland, Oregon • Service providers offer different rates for different volumes shipped with average rates:
Empirical Model • Using these data, our dependant variable is: log(Rail Rate per Car) • Cost variables are: • The Capacity of the shipment, • The Distance of the shipment, and • Whether the rate pertains to a unit train shipment
Empirical Model • For modal competitive pressure, we pursue several empirical strategies, all of which rely on the distance from the shipment origin to the nearest waterway corn shipping facility • These distances are calculated using GIS and the Army Corps of Engineer’s port facilities database:
Empirical Model • Our measures of barge competition include (in separate regressions): • Case 1: • The distance to the nearest constraining port facility using an endogenous switch point methodology, and • Case 2: • The distance to the nearest constraining port facility, • The cumulative distance to all constraining port facilities, • The number of constraining port facilities available, and • A set of dummy variables indicating which river is the nearest constraining waterway
Empirical Model • We also note that shipments to the Pacific Northwest don’t have the possibility of being shipped via barge, therefore: • We include a dummy variable equal to 1 for shipments bound for the Pacific Northwest, and • We estimate our model both pooled and by destination
Empirical Model • Other markup and elasticity variables include: • For railroad competition we use the inverse of the Herfindahl index for each location • We also note that ethanol plays a role in this market, which is captured by including both: • The ethanol capacity of plants within 60 miles of the origin, and • A dummy variable equal to 1 for origins with no ethanol within 60 miles:
Results • Railroad specific fixed effects are included in our results to capture railroad specific pricing patterns • We present our results first for the cost variables and then for the competitive pressure variables:
Results – Cost Variables • Our results indicate that: • Differences in the capacity of shipments can lead to as much as a $567 per car difference in rail rates, • Differences in the distance of shipments can lead to as much as a $1,250 per car difference in rail rates, and • Unit train shipments are up to $252 less per car
Conclusion • We examine rail pricing in the presence of competitive pressures • Our findings indicate that rail rates do vary with the level of competition present • This competition may be intra- or inter-modal and may come from other markets as well • Current research – introduction of barge prices and locally weighted regressions to delineate differences across shippers and waterways.
Locally Weighted GeographicCurrent Experiment • There are seven different waterways that may be options. • All are theoretically possible as are a myriad of other options. • Not all are constraining, and those that do constrain vary across the locations in the data. • We are using locally weighted regressions in an attempt to uncover the constraining options and how they vary across spatial locations. • Results thus far do not suggest much spatial variation in the parameters. • Current state is to delineate constrained from unconstrained locations.