Download

1 / 18
180 likes | 291 Vues
Explore the influence of population size on natural selection patterns in mammals using aggregated models and rigorous filters, with a focus on orthologous genes and branch-specific selective pressures. Analyze rates of positive selection across various mammalian species, incorporating Bayesian model selection and fixation probabilities. Gain insights into the impact of population size on nonsynonymous-synonymous rate ratios.

E N D
The influence of population size on patterns of natural selection in mammals Carolin Kosiol <kosiol@cornell.edu> Cornell University 21st December 2007 Isaac Newton Institute
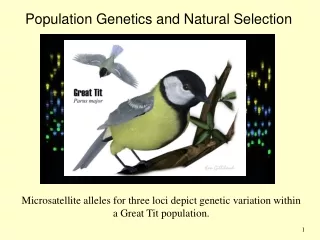
0.05 human chimp macaque mouse rat dog Six Mammalian Genomes Based on multiple alignments (RefSeq, Vega, and UCSC Known Genes). Rigorous filters (spurious annotations, paralogous alignments, pseudogenized). Include genes where the sequences of up to three species are missing as well as truncated genes. 17489 human / chimp / macaque / mouse / rat / dog orthologous genes.
aggregated models Measuring selective pressures I ATT Ile nonsynonymous substitution CTT L Leu CCT P Pro synonymous substitution Pro CCG P < 1purifying selection • = 1neutral evolution • > 1positive selection is defined as the nonsynonymous-synonymous rate ratio
Average rates of positive selection 0.249 human 0.202 0.05 0.172 chimp 0.245 macaque 0.191 0.127 0.125 mouse 0.121 rat 0.140 dog branch specific nonsynonymous -synonymous rate ratios
Per gene analysis Frequency P-value: 2.2x10⁻¹⁶ Nonsynonymous-synonymous rate ratio
Likelihood Ratio Tests (LRTs) for positive selection • Branch-site models (Yang & Nielsen, 2001, 2005 ) tofind positively selected genes (PSGs) on • Any branch • Specific internal and external branches • Specific clades • We identify 544 putatively positively selected genes (PSGs) in all test.
0.249 primate clade human 0.202 0.05 0.172 chimp 0.245 macaque 0.191 0.127 0.125 mouse 0.121 rat 0.140 dog primate branch branch specific nonsynonymous -synonymous rate ratios rodent branch PSG: 21/9566 PSG: 56/8991 rodent clade PSG: 24/14425 PSG: 400/16529 PSG: 61/10762 human hominid chimp macaque PSG: 10/14558 PSG: 18/14558 PSG: 7/10980 PSG: 16/12499
Previous scans on mammalian genomes 0.05 Clint (Nature,2005) “[…] The diversity in West African chimpanzees is similar to that seen for human populations. The observed Clint is broadly consistent with West African origin …” (PNAS, 2007) human “[…] These observations are explainable by the reduced efficacy of natural selection in humans because of their smaller long-term effective population size …” chimp macaque
The effective population size N and probability of fixation where s>0 mutation is selectively favoured s<0 mutation is selectively disfavoured For the neutral case (s = 0) this is simply the initial frequency of mutation 1/2N. Let 2N the number of chromosomes. Then (Kimura 1969)
Rates of mutations The fixation rate of a new mutations is the product of the mutation rate per site, the chromosomal population size 2N and the probability of fixation: The rate of neutral mutations is
‘Popgen Omega’ Rate for selected mutations s = ∙ 4Ns/(1-e-4Ns) Rate for neutral mutations 0 = where = 2Ns (Bruno &Halpern 1998 Nielsen & Yang, 2003, Thorne et al., 2007).
Population genetic interpretation of Advantages: • Accounts for multiple substitutions per site • can be calculated for each lineage (branch model) • Improves understanding of effects of population size N on the nonsynonymous-synonymous rate ratio Disadvantages: • Assumes that sites are independent • Instantaneous change of population size at speciation • N and s always come as a product =Ns and cannot be estimated separately by ML techniques
0.05 human chimp macaque mouse rat dog Comparison to estimates from polymorphism data Estimation from 10980 genes: Nm/Nh= 1.40 95% CI =(1.15, 1.64) Population genetics: Nm = 73000 (Hernandez et al.,2007) Nh =40,000-70,000 (Wall, 2003) => Nm/Nh = 1.04-1.82 Nh Nc= Nh Nm
LRT for population size ratios • Model1: h= c, m • Model2: h= c, m = c(Nm/Nh) x h • For 10496 out of 10980 (95.6%) no significant deviation for was observed. • The differences in selection pressures are well described by differences in differences in population size.
Summary • The population genetic interpretation of is helpful to understand differences between selection pressures. • For human-chimp macaque trios our estimates of population size ratios agree with estimates from population genetics. • An LRT shows that differences in selection pressure are well explained with the differences in population size.
0.05 0.05 human human chimp chimp macaque macaque mouse mouse rat rat dog dog Mammalian (Xmas) Tree Re-interprete the mammalian tree!
Thanks Siepel Labs (Cornell) Adam Siepel, Tomas Vinar, Brona Brejova, Adam Diehl, Alex Denby Bustamante Lab (Cornell) Carlos Bustamante,Adam Boyko, Adam Auton, Badri Padhukasahasram, Abra Brisbin, Kasia Bryc, Jeremiah Degenhardt, Ryan Hernandez, Emilia Huerta-Sanchez, Lin Li, Kirk Lohmueller, Hong Gao, Amit Indap, Dara Torgeson Rasmus Nielsen (Copenhagen) Tanja Gesell (Vienna) NIH and NSF for funding