Quantifying Airway Constriction in Asthma through Image-Assisted Anatomical Modeling
This study explores the distribution of airway constriction in mild to moderate asthma patients using image-assisted anatomical modeling. By employing positron emission tomography (PET) and computational lung modeling, we analyze the impact of both homogeneous and heterogeneous bronchoconstriction on lung mechanics. Our findings suggest a significant relationship between constriction patterns and mechanical function, with implications for improving asthma management. The advanced 3D models facilitate predictions of lung function based on anatomical variations and constriction distributions.

Quantifying Airway Constriction in Asthma through Image-Assisted Anatomical Modeling
E N D
Presentation Transcript
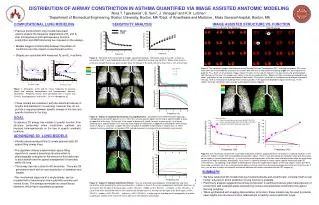
Mild-Moderate Asthmatic Pre Challenge Post Challenge closure closure baseline baseline B A C D b a A B DISTRIBUTION OF AIRWAY CONSTRICTION IN ASTHMA QUANTIFIED VIA IMAGE ASSISTED ANATOMIC MODELING Nora T. Tgavalekos1, B.Suki1, J. Venegas2 and K.R. Lutchen1 1Department of Biomedical Engineering, Boston University, Boston, MA2Dept. of Anesthesia and Medicine , Mass General Hospital, Boston, MA COMPUTATIONAL LUNG MODELING SENSITIVITY ANALYSIS IMAGE ASSISTED STRUCTURE VS. FUNCTION Mean • Previous morphometric lung models have been • used to explore the frequency dependence of RL and EL • after homogeneous and heterogeneous broncho- • constriction and ASM shortening are imposed on the airways. • Models suggest a relationship between the pattern of • constriction and the impact on mechanical function. • Shapes are consistent with measured RL and EL in asthma. ±SD Figure 2: Sensitivity of the lung model to random constriction patterns.Simulation were all run with a mean (m) constriction of 50 % and standard deviation (SD) of 70% applied to the entire lung (d<2mm.) Monte Carlo analysis of 20 runs showed that for any given random draw, the change in RL and EL will be no more than ±10% of the mean. Figure 5: The ventilation images were obtained using Positron Emission Tomographic (PET) scanning techniques. PET scans were taken on a mild-moderate asthmatic at baseline (left) and after a methacholine challenge (right) at a dose equal to the patient’s PC10. Each set of ventilation images contain 15 slices of the lung, the top left is the apex of the lung and the bottom right the base of the lung. The images were taken in the cranio-caudal direction. Regions of high ventilation correspond to light colors and regions of low ventilation correspond to dark colors. At baseline, ventilation is homogenously distributed throughout the lung. After a methacholine challenge there are dark patches in the upper and dependent regions of the lung. These regions have low ventilation, which may be a consequence of gas trapping. Figure 1:Simulations of RL and EL versus frequency for baseline (black) and following homogeneous and heterogeneous broncho-constriction. Peripheral airways were constricted with a m=20% and CV=50% (Heterogeneous) and m=20%, CV=0%(Homogeneous). • These models are consistent with the statistical features of lengths and diameters in a real lung, however they do not provide a mapping between specific airways in the tree and specific locations in the lung. c GOAL Figure 3:Impact of Localized Constriction on Lung Mechanics. Simulations were performed after imposing a heterogeneous constriction pattern (m=50 %, SD=70%) on only specific regions of the lung a) apex b) middle c) lower d) upper half of the lung. On the right is the impact of dynamic RL and EL for each of these cases. In all cases affecting only a specific region has a relatively minor impact on mechanics as opposed to affecting the entire lung as shown in Figure 2. Color bar in upper left corner describes the degree of constriction in each branch i.e. white represents airways diameters at baseline FRC and red represents to airways that are closed or nearly closed. To advance 3D airway tree models to predict function from structure particularly when constriction patterns are imposed heterogeneously on the tree in specific anatomic locations. ADVANCING 3D LUNG MODELS • Kitaoka advanced algorithms to create geometrically 3D space filling airway trees. •The algorithm utilizes a deterministic space-filling algorithm to create a branching structure which is physiologically consistent in the amount of fluid delivered to each branch and the spatial arrangement of branches within the lung. Figure 6: The mechanical impact of the lung model at baseline and after applying different constrictions on specific locations in the airway tree model is shown with corresponding lung cartoons above. There is very little impact on mechanics when only the cranial-dorsal region is severely constricted (a). It is not until the remaining portions of the tree have mild constriction when the mechanical response will begin to changes dramatically. Also shown is a general attempt to match subject specific mechanical and PET measurements. By applying a high degree of heterogeneity to only the upper dorsal regions of the lung (regions shown by PET to have under ventilation) (d<2 mm.) and constriction pattern with the same mean but lower heterogeneity to the rest of the tree (d< 2 mm.), we are able to match the subject’s mechanical data and still remain consistent with the PET images (b). • The airway tree has a total 50,400 branches. There are 28 generations each with its own distribution of diameters and lengths. SUMMARY • We have advanced 3D models that are morphometrically and anatomically consistent with a real human lung and in which prediction of lung functionis possible • Preliminary analysis suggests that airway constriction in asthma produces gross heterogeneity of constriction with localized areas experiencing closure and substantial constriction throughout the lung periphery • When synthesized with imaging data sensitive to function, these models may be used to provide new insights into structure-function relationships in healthy versus asthmatic lungs • The mechanicalresponseof a single airway can be modeled with a transmissionlinemodel with resistive and inertial forces. The airways terminate into alveolitissue elements, which have viscoelastic properties. Figure 4: Impact of Variable Constriction Pattern. Here we examined varying degrees of heterogeneity and mean constriction while impacting the entire lung. Baseline is in black. In Case A, the mean and degree of constriction decreases as one moves from the apex to the base (apex: m=50%, SD=70% , middle: m=40% SD=40%, and base: m=30%, SD=30%). In Case B the mean constriction remains the same but the SD decreases as moving from the apex to the base (apex: m=50%, SD=70% , middle: m=50% SD=40%, and base: m=50%, SD=30%). In order to get a high degree of heterogeneity in function a significant fraction of the lung must have a high mean and spread in constriction