
SCL3
A. SCL3. MGP. Fold Enrichment. Fold Enrichment. Distance from ATG (kb). Distance from ATG (kb). SCR. NUC. Fold Enrichment. Fold Enrichment. Distance from ATG (kb). Distance from ATG (kb). B. SCL3. MGP. 3. 3. 2. 2. Fold Enrichment. Fold Enrichment. 1. 1. 0. 0. SCR. NUC.

SCL3
E N D
Presentation Transcript
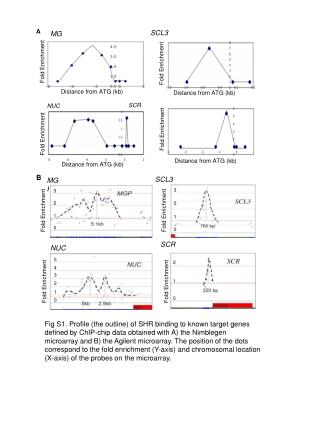
A SCL3 MGP Fold Enrichment Fold Enrichment Distance from ATG (kb) Distance from ATG (kb) SCR NUC Fold Enrichment Fold Enrichment Distance from ATG (kb) Distance from ATG (kb) B SCL3 MGP 3 3 2 2 Fold Enrichment Fold Enrichment 1 1 0 0 SCR NUC 5 2 4 3 Fold Enrichment Fold Enrichment 1 2 1 0 0 Fig S1. Profile (the outline) of SHR binding to known target genes defined by ChIP-chip data obtained with A) the Nimblegen microarray and B) the Agilent microarray. The position of the dots correspond to the fold enrichment (Y-axis) and chromosomal location (X-axis) of the probes on the microarray.