Download
1 / 6
60 likes | 209 Vues
Tomorrow’s Cities, Tomorrow’s Suburbs documents signs of resurgence in cities and interprets omens of decline in many suburbs.

E N D
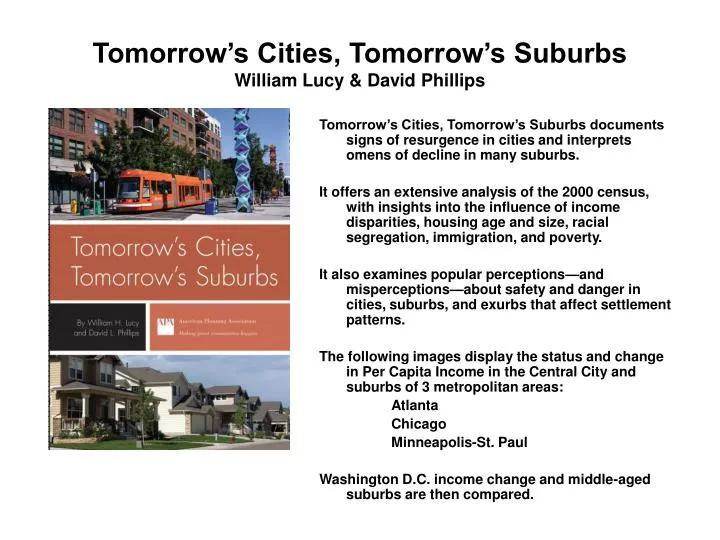
Tomorrow’s Cities, Tomorrow’s Suburbs documents signs of resurgence in cities and interprets omens of decline in many suburbs. It offers an extensive analysis of the 2000 census, with insights into the influence of income disparities, housing age and size, racial segregation, immigration, and poverty. It also examines popular perceptions—and misperceptions—about safety and danger in cities, suburbs, and exurbs that affect settlement patterns. The following images display the status and change in Per Capita Income in the Central City and suburbs of 3 metropolitan areas: Atlanta Chicago Minneapolis-St. Paul Washington D.C. income change and middle-aged suburbs are then compared. Tomorrow’s Cities, Tomorrow’s SuburbsWilliam Lucy & David Phillips
Relative Per Capita Income Change 1990-2000 Suburbs of Atlanta, Ga. MSA 1990 2000 Relative Per Capita Income Status
Relative Per Capita Income Change 1990-2000 Suburbs of Chicago PMSA 1990 2000 Relative Per Capita Income Status
Relative Per Capita Income Change 1990-2000 Suburbs of Minneapolis-St.Paul MSA 1990 2000 Relative Per Capita Income Status
Relative Median Family Income Change 1990-2000 Suburbs of Washington D.C. PMSA
Nationally, suburbs with a preponderance of their housing built in the 1950’s and 1960s are those with greater likelihood of falling behind their metropolitan areas in Income Growth Here the change in relative family incomes for Washington D.C. MSA is compared with the map of “middle aged” suburbs. Proportion of 2000 housing stock Built in the 1950s and 1960s High Modest Low Very Low