Ecological Footprints Material (Resource) Flow Analysis
Ecological Footprints Material (Resource) Flow Analysis. Scott Matthews 12-712 / 19-622 Lecture 7. Administrative Issues. HW 2 Solutions, Returned HW 3 Due Today Thoughts on Due Dates for Final/etc? Project Report Updates Due Short class today. Timeline Planning.

Ecological Footprints Material (Resource) Flow Analysis
E N D
Presentation Transcript
Ecological FootprintsMaterial (Resource) Flow Analysis Scott Matthews 12-712 / 19-622 Lecture 7
Administrative Issues • HW 2 Solutions, Returned • HW 3 Due Today • Thoughts on Due Dates for Final/etc? • Project Report Updates Due • Short class today
Timeline Planning Main question is when to make projects, take home finals due Note Friday 10/17 is “midsemester break”
Cities • More than 50% of population in cities, growing • Why the crunch from rural to urban? • Ability to meet needs locally versus needing to depend on transport/etc for fulfillment • Where does food come from (1000s of miles) • Not just a developed world issue – developing world shifting quickly • Interdependence, also globalization of production./cost minimization/etc • New supply chains, including refrigeration • Tradeoffs between simplicity of meeting needs locally versus potential scale of distant production. Which weighs more? • Urbanization tends to magnify the imapcts because of the large scale (non-linear)
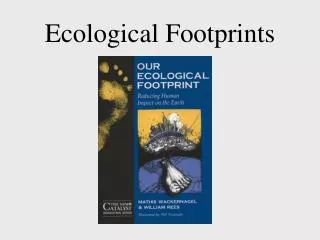
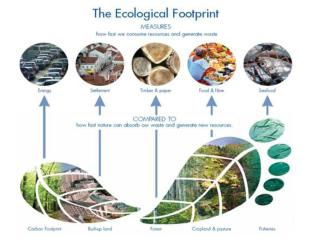
Summary: An Ecological Footprint Process Factors in a number of categories of consumption and use Converts these inputs to a quantity of land One specific model used Redefining Progress Based on research of Wackernagel and Rees http://www.absentofi.org
Ecological Footprintfrom www.footprintnetwork.org (specifically the data/methods page) • An indicator that takes a variety of inputs and converts into equivalent land use • e.g., carbon emissions need biocapacity to be mitigated • Food/etc – land needed to farm it • Relevant benchmark “number of earths” (similar to carrying capacity) • “Earths” basis defined by biocapacity • See the reports and spreadsheets there if you have not already done so!
Biocapacity vs. Ecological Footprint • Units: global hectares (equivalent land measure) 2003 difference: about 25%. Meaning?
Delving Deeper into EF Approach • Majority of resources we use can be approximated by biocapacity (biologically productive area) needed to sustain it • Those that cannot be estimated are excluded (examples/effect)? • Describe the kinds of data needed for the biocapacity and EF side of such a comparison • Carbon land: first considers ocean uptake, everything else forest sequestration • Used to compare national resource consumption with bioproductive land available • 200 resource categories
Relevant Country Measures • Macro-level (total global hectares) and ratios for each country, and per-capita
Highest/Lowest • Where is US? • Top Five “Worst” Top Five “Best”
Lower Levels • Ecological Footprints at local levels “spatial ft-prints” • Same data/etc. • Alternate visualization • e.g., urban funnels (Grimm 2001)
Distribution of Agricultural Food Production Increasing Data: US Department of Agriculture 1998
Distribution of Renewable Water Availability (Precipitation - Evapotranspiration) Precipitation: Daly and Taylor 1994; ET (Actual): Ahn and Tateishi 1987
Distribution of Carbon Assimilation Increasing Data: Century model by VEMAP project
Spatially Explicit Ecological Footprintsfor Phoenix, AZ Water Food Note –circles are traditional method of calculating footprint, for each resource
Central Arizona Project Canal EFs Domestic + agricultural water use CAP canal watershed Domestic water use only
Caveats/Discussion • EF is just one, albeit highly controversial approach. • However its in the right direction of sustainability metrics, especially with respect to scientific data/methods and showing results by country/etc.