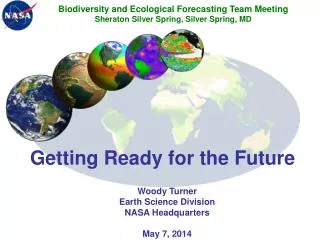
Getting Ready for the Future
Biodiversity and Ecological Forecasting Team Meeting Sheraton Silver Spring, Silver Spring, MD. Getting Ready for the Future. Woody Turner Earth Science Division NASA Headquarters May 7, 2014. NASA Earth Science Missions Current & Planned Plus Earth Ventures.

Getting Ready for the Future
E N D
Presentation Transcript
Biodiversity and Ecological Forecasting Team Meeting Sheraton Silver Spring, Silver Spring, MD Getting Ready for the Future Woody Turner Earth Science Division NASA Headquarters May 7, 2014
NASA Earth Science Missions Current & Planned Plus Earth Ventures
Why We Launch the Missions Earth Science Applications Areas: Earth Science Focus Areas: Climate Variability & Change Atmospheric Composition Carbon Cycle & Ecosystems Water & Energy Cycle Weather Earth Surface & Interior Disasters Water Resources Health & Air Quality Ecological Forecasting
Round Two Notional Schedule for Next Earth Science Decadal Survey
Much Remains to Do from 2007 (NRC, Earth Science and Applications from Space, 2007)
Top 10 Questions for Conservation that can be addressed via Remote Sensing • How can global Earth observation data be integrated into models of species distributions and abundances to inform conservation action? • How can remote sensing improve the understanding of the processes controlling spatial and temporal dynamics of animal movements? • How can remotely sensed ecosystem variables be used to understand, monitor, and predict ecosystem response and resilience to multiple stressors? • How can remote sensing monitor the rate, magnitude, and spatial and temporal effects of climate on ecosystems? • How can near real-time ecosystem monitoring catalyze environmental enforcement, governance and compliance, and resource management decisions? • How can remote sensing inform configuration of protected area networks at spatial extents sufficient to maintain ecologically functional and resilient populations of target species and maintenance of ecosystem services? • How can remote sensing-derived products be used to value and monitor changes in ecosystem services? • How can remote sensing and associated analytical tools be used to monitor and evaluate the effectiveness of conservation efforts? • How does the rate and pattern of expansion and intensification of agriculture and aquaculture alter ecosystems and the services they provide? • How can remote sensing be used to determine the degree to which ecosystems are being disturbed or degraded, and the effects of these changes on species and ecosystem functions?(used with the permission of WCS/Robert Rose)
What are your key questions and themes for NASA Biodiversity and Ecological Forecasting?
Guidelines for Breakout Groups • Self-select into 3 groups: Marine, Terrestrial Research, Terrestrial Applications • Each Group has a facilitator and rapporteur • Brainstorming: at start, each person has 10-20 seconds to suggest a key question or theme in biodiversity research or ecological forecasting with a remote sensing connection; rapporteur captures • After going around, use the remaining breakout time to refine these questions/themes as well as suggest and refine new ones • In plenary: speaker for each group spends 5 minutes reporting out questions and themes followed by 10 minutes discussion on that group’s questions and themes; x 3 = 45 minutes • Remaining 25 minutes in plenary for general discussion as well as consideration of next steps (the process) for the NASA Biodiversity and Ecological Forecasting programs to follow leading to Decadal Survey
Terrestrial Research • Global land cover and disturbance (annual, 100m, continuous fields and nested classification, 1970 onwards where possible) • Natural and human influence and response • Continuity of global daily moderate resolution vegetation indices (consistency between AVHRR, MODIS, VIIRS records) • Link to climate; vegetation productivity and change, short and long term dynamics • Global sampling of Lidar (small footprint), systematic acquisition and opportunistic/tasked drone • 3D vegetation structure and terrain
Marine Group Feedback • Implement an observational system that will allow the collection of biodiversity and optics information to assess biodiversity from space. This system will include sentinel sites and surveys (coastal and pelagic) • Hyperspectral and hyperspatial data in the global coastal zone and deep ocean (spatial resolution to scale with the distance from the coast) • Develop Marine biodiversity model comprising global, basin and regional scales within a CF compliant framework. Develop tools to facilitate easy exchange of biodiversity data and data products • Develop an interagency and international policy framework to establish a comprehensive biodiversity observational network that links across land, ocean, and air
Terrestrial Applications • 3D Canopy Structure • Habitat structure upon which biodiversity depends • Biomass, degradation • Fuel loads • Large complimentary with other sensors (fusion) • Open Access to and standardization of the results of what NASA funds • Improved ease of use • Standardized QA, formats, metadata, geo-referencing, coordinate system, and units • Accessibility after standard period • “MODISization” of Landsat • Examples of products include: Land cover, land cover change, productivity, disturbance, phenology, vegetation indices