Data Splitting: Crucial for Machine Learning Success
Learn why splitting data is vital in machine learning experiments. Discover the impact of training and testing sets on model accuracy and errors. Explore the importance of K-values in classifiers and cross-validation techniques. Dive into ROC analysis and confusion matrices for in-depth model evaluation, with practical examples and considerations for decision-making. Master the art of data handling for optimal machine learning outcomes.

Data Splitting: Crucial for Machine Learning Success
E N D
Presentation Transcript
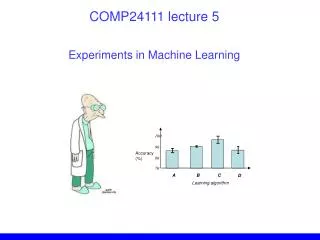
COMP61011 Experiments in Machine Learning
Scientists vs Normal People
Learning Algorithm • Split our data randomly • Train a model… • Test it! • Why do we split the data?
The Most Important Concept in Machine Learning… Looks good so far…
The Most Important Concept in Machine Learning… Looks good so far… Oh no! Mistakes! What happened?
The Most Important Concept in Machine Learning… Looks good so far… Oh no! Mistakes! What happened? We didn’t have all the data. We can never assume that we do. This is called “OVER-FITTING” to the small dataset.
Inputs Labels
Inputs Labels 50:50 (random) split
Training set Train a K-NN or Perceptron on this… Ideally should be small. Smaller is better. But if too small... you’ll make many mistakes on the testing set. Testing set … then, test it on this! “simulates” what it might be like to see new data in the future Needs to be quite big. Bigger is better.
Training set Build a model (knn, perceptron, decision tree, etc) Testing set How many incorrect predictions on testing set? Percentage of incorrect predictions is called the “error” e.g. “Training” error e.g. “Testing” error
Classifying ‘3’ versus ‘8’ digits Plotting error as a function of ‘K’ (as in the K-NN) error K Training data can behave very differently to testing data! Percentage of incorrect predictions is called the “error” e.g. “Training” error e.g. “Testing” error
Which is the “best” value of k? Different random split of the data = different performance! 100 90 Accuracy (%) 80 70 1 3 5 7 K value used in knn classifier MATLAB: “help errorbar”
Error bars (a.k.a. “confidence intervals”) Plots the average, and the standard deviation (spread) of values. Wider spread = less stability…. 100 90 Accuracy (%) 80 70 1 3 5 7 K value used in knn classifier MATLAB: “help errorbar”
MATLAB: “help crossfold” Cross-validation We could do repeated random splits… but there is another way… • Break the data evenly into N chunks • Leave one chunk out • Train on the remaining N-1 chunks • Test on the chunk you left out • Repeat until all chunks have been used to test • Plot average and error bars for the N chunks All data 5 chunks Train on these (all together) Test on this … then repeat, but test on a different chunk.
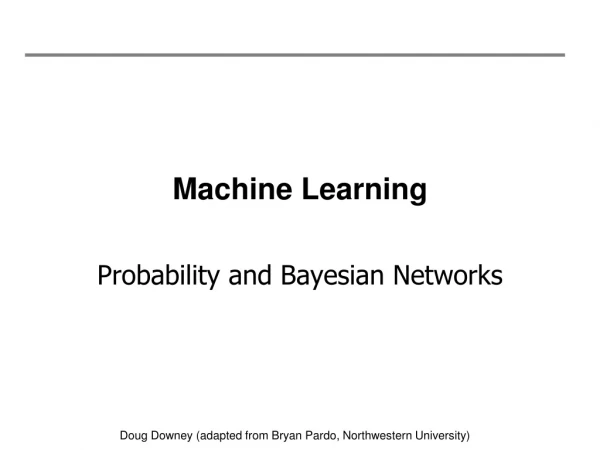
100 90 Accuracy (%) 80 70 A B C D Learning algorithm What factors should affect our decision? • Accuracy • - How accurate is it? • Training time and space complexity • How long does it take to train? • How much memory overhead does it take? • Testing time and space complexity • How long does it take to execute the model for a new datapoint? • How much memory overhead does it take? • Interpretability • - How easily can we explain why it does what it does?
Best testing error at K=3, about 3.2%. Is this “good”?
Zip-codes: “8” is very common on the West Coast, while “3” is rare. Making a mistake will mean your Florida post ends up in Las Vegas!
Sometimes, classes are rare, so your learner will not see many of them. What if, in testing phase you saw 1,000 digits …. 32 instances 968 instances 3.2% error was achieved by just saying “8” to everything!
Solution? 32 instances 968 instances 0% correct 100% correct Measure accuracy on each class separately.
ROC analysis 32 instances 968 instances Our obvious solution is in fact backed up a whole statistical framework. Receiver Operator Characteristics Developed in WW-2 to assess radar operators. “How good is the radar operator at spotting incoming bombers?” False positives – i.e. falsely predicting a bombing raid False negatives – i.e. missing an incoming bomber (VERY BAD!)
ROC analysis The “‘3” digits are like the bombers. Rare events but costly if we misclassify! False positives – i.e. falsely predicting an event False negatives – i.e. missing an incoming event Similarly, we have “true positives” and “true negatives” Prediction 0 1 0 1 Truth
Building a “Confusion” Matrix Prediction 0 1 0 1 Truth TP … chances of spotting a “3” when presented with one (i.e. accuracy on class “3”) Sensitivity = TP+FN TN … chances of spotting an 8 when presented with one (i.e. accuracy on class “8”) Specificity = TN+FP
ROC analysis… your turn to think… TN TP Specificity = = ? Sensitivity = = ? TN+FP TP+FN Prediction 0 1 60+30 = 90 examples in the dataset were class 0 0 1 Truth 80+20 = 100 examples in the dataset were class 1 90+100 = 190 examples in the data overall
ROC analysis – incorporating costs… FP = total number of false positives I make on the testing data FN = total number of false negatives I make on the testing data Useful if one is more important than another. For example if a predictor… … misses a case of a particularly horrible disease (FALSE NEGATIVE) or … sends a patient for painful surgery when it is unnecessary (FALSE POSITIVE)
Experiments in Machine Learning • Learning algorithms depend on the data you give them • some algorithms are more “stable” than others • must take this into account in experiments • cross-validation is one way to monitor stability • plot confidence intervals! • ROC analysis can help us if… • there are imbalanced classes • false positives/negatives have different costs
Conclusion • Reading for this week : • 1. My notes • 2. Paper: “A training algorithm for optimal margin classifiers” • 3. Paper: “A Practical Guide to SVM classification” • The material above is part of the course, i.e. non-optional reading. • In your mini-projects, you will be expected to use techniques acquired from the above, in order to pick up the highest grades.